

Debt Ceiling Showdown: Clean Energy at Risk
Debt Ceiling Showdown: Clean Energy at Risk
Green Edge Portfolio Performance Update for April 2023

The stage is being set for a Debt Ceiling showdown between Republicans and the Administration. It is expected that the U.S. could default on its debt as early as June 5, 2023. In the GOP-controlled House vote last week, the “Limit, Save, Grow” Act passed 217-215 that would raise the debt ceiling in exchange for $4.5 trillion in cuts to government spending. This bill would repeal the majority of the clean energy incentives enacted by the Inflation Reduction Act (IRA).
Note that since the passage of the IRA, companies have already announced or started projects that would create over 142,000 new clean energy jobs and about 2/3 of them are located in districts where republican lawmakers oppose IRA. Although I don’t believe the bill will pass the Senate or be enacted, clean energy stocks were hammered this month.
With that backdrop, let’s dig into April results. (Thanks for the upbeat start, Dan).
Portfolio Update - April 2023
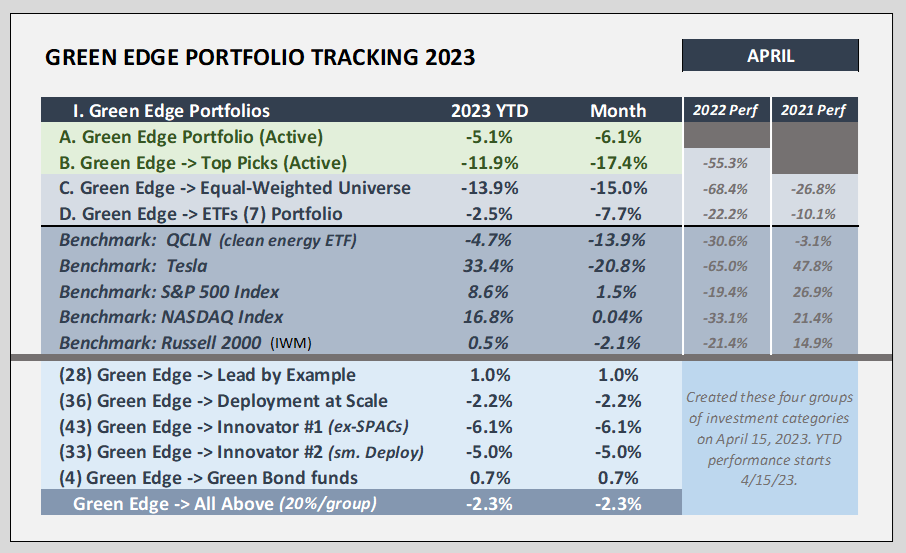
The S&P 500 Index moved up slightly by 1.5% while the NASDAQ remained virtually unchanged for April, up 0.04%. The small cap Russell 2000 Index was down -2.1% last month. This is a good time to highlight the (lack of) breadth of the YTD positive returns of 8.6% and 16.8% in the indexes, respectively, while the Russell is close to even, up 0.5%.
The chart below shows a very important insight for the market thus far in 2023. It is a comparison of the largest 50 companies (XLG) in the S&P compared to an equal-weighted S&P 500 index (RSP). The XLG has returned 15.36% YTD while the RSP’s return is only 2.75%. The divergence between the two has really taken off since the beginning of March. In the last two months, XLG is up over 10% while the RSP is down about 1%. Bottom line: there are fewer companies participating in the 2023 bullish market and they tend to be the large cap names.
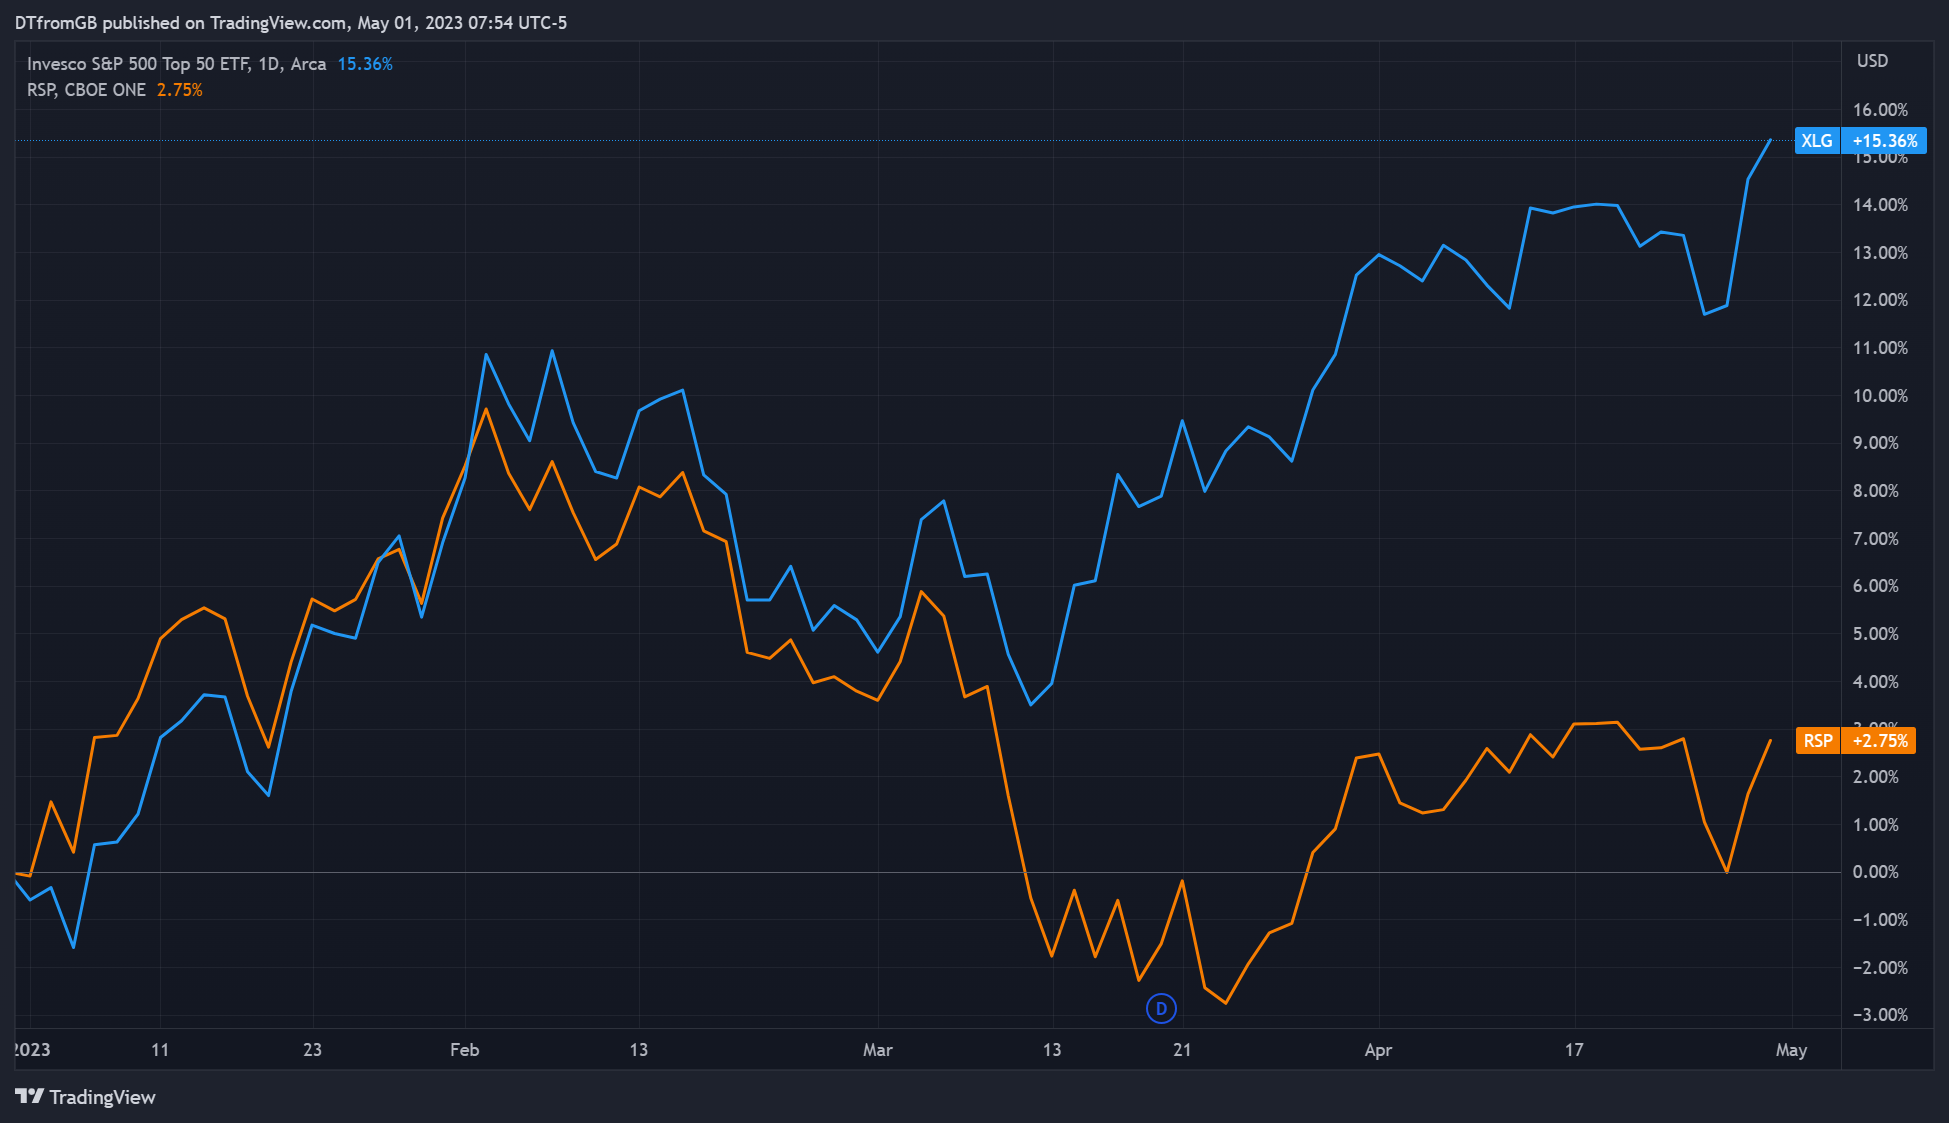
Is this good for the future market returns? Will the small and mid-cap names follow through in the next few months to catch up to the top 50? Or is it a house of cards ready to tumble? Great questions, D.T., but we will only know in hindsight. That said, it doesn’t feel good when only a small portion of the market is participating in the market upturn. But this divergence could continue to play out as the S&P could grind higher for a couple hundred more points. Time will tell, but I will be a bit cautious overall in May.
You are invited to subscribe to the Green Edge portfolios newsletter here.
Green Edge Portfolios
Our Clean Energy ETF portfolio tells the story for clean energy stocks in April —> down 7.7%. That is a bad month, especially considering the breadth in the hundreds of stocks included within these ETFs, including global companies. The higher risk clean energy SPACs got slaughtered in April with the equal-weight down 15% and top picks down 17.4%.
There are a few companies common in the top 10 holdings for many of the clean energy ETFs. These include companies such as Enphase (ENPH), First Solar (FSLR), and SolarEdge Technologies (SEDG). ENPH and FSLR both had a poor Q1 quarterly reports and price got hit hard. In the last week of April, ENPH was down 26.6%, FSLR down 15.8%, and SEDG went down in sympathy 10.5%, hurting the ETFs (and many of the Green Edge portfolios).
Enphase Energy (ENPH) Q1 Non-GAAP EPS of $1.37 beats by $0.15. Revenue of $726.02M (+64.5% Y/Y) beats by $5.51M. It expects Q2 revenues of $700M-$750M, below the $760M analyst consensus estimate, and gross margin of 41%-44%, which would come in below Q1. ENPH also received a downgrade from Bank of America that added to the spiral down.
First Solar (FSLR) GAAP EPS of $0.40 misses by $0.62, revenue of $548.29M misses by $168.37M. But they do re-confirm 2023 Outlook of Net Sales $3.4B to $3.6B; and EPS $7.00 to $8.00, aligned with expectations.
In the de-SPACed companies, MP materials got a downgrade and lost 23% for the month. EV charging companies ChargePoint and EVgo lost 17% and 23%, respectively. To round out the contagion, STEM was down 23% and INDI down 28%. EV manufacturers Lucid (LCID) and Polestar (PSNY) held their ground, -1% and +1%, while Fisker (FSR) had good news on production and moved up +5%.
New Green Edge categories
The Green Edge Portfolio is structured to achieve a balance between environmental sustainability and financial returns by allocating resources across three main categories of companies, in addition to a green bond fund and cash. The portfolio is designed to allocate 20-30% of its resources into each group, with 5-25% allocated to the bond fund and 5-25% kept in cash to take advantage of market opportunities. Our objective is to build a clean and green portfolio that can match or outperform the S&P 500 over the long term.
Effective March 30, 2023, the portfolio began trading, and as of April 15, 2023, we began tracking 144 stock tickers across the three categories, which will be reported monthly in this newsletter's core tracking table. In the following sections, we'll provide detailed descriptions of each category.
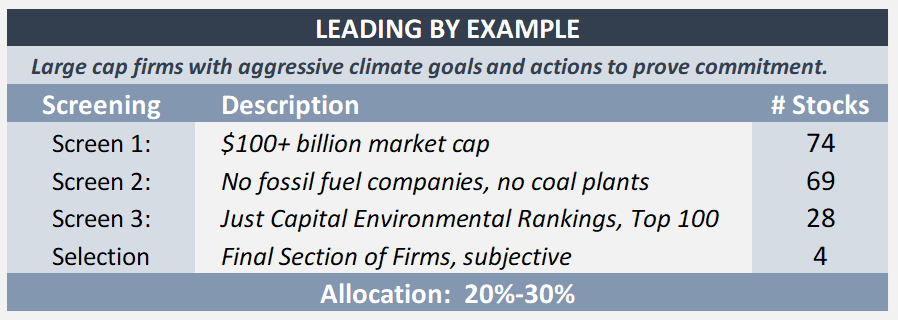
Lead by Example. This group is a collection of large-cap companies with a market capitalization of $100 billion or more that demonstrate a commitment to environmental sustainability. This group specifically excludes any companies involved in the fossil fuel industry. To be included in this group, companies must rank in the top 100 on Just Capital's environmental score, ensuring that they have not only made environmental pledges but have also taken tangible steps to support these efforts. This group is made up of companies that have demonstrated a strong environmental track record, and are committed to sustainable practices, making them an attractive investment option for those seeking to prioritize environmental responsibility in their investment portfolio. The table below shows the screening of how the 74 companies over $100 billion get down to 28 available to be chosen.
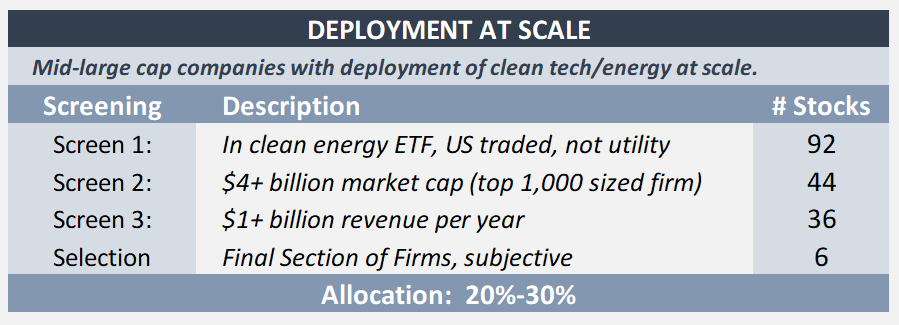
Deployment at Scale. This group consists of mid- to large-cap companies that are focused on reducing carbon emissions through their products and/or services. These companies are deploying renewable energy solutions such as wind or solar, electric vehicles, batteries, and other clean energy technologies at scale. To be included in this group, companies must be part of a clean energy ETF, have a market capitalization of over $4 billion (top 1,000 sized firm), generate at least $1 billion in annual revenue, and have a stock traded on a US exchange. The group comprises 36 stocks that have been carefully screened and selected for their commitment to clean energy solutions and their ability to make a significant impact in reducing carbon emissions. This group offers investors an opportunity to invest in companies that are at the forefront of the clean energy revolution, providing potential for both financial returns and a positive environmental impact.
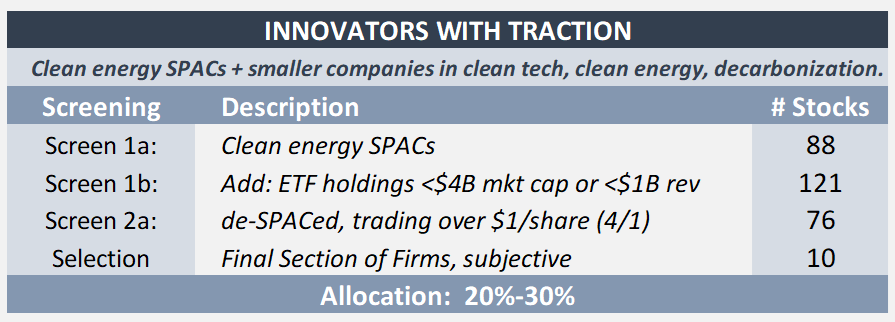
Innovators with Traction. This group is made up of companies that are bringing innovative solutions to the climate tech sector. It includes two different paths: First, companies in the clean energy sector that have gone public since January 1, 2020, totaling 88 companies, that offer new products and services to help the environment. Second, companies in clean energy ETFs from the Deployment at Scale group that have a market capitalization under $4 billion and/or generate less than $1 billion in annual revenue, totaling 33 companies. The combined universe of this group is 121, which was screened down to 76 stocks by ensuring they traded over $1/share and were de-SPACed. These companies are at the forefront of innovation in the climate tech sector and offer investors an opportunity to invest in emerging technologies and solutions that are aimed at mitigating climate change.
Below is a graph of the number of climate tech companies that went public by quarter from 2020 through 2022.

v
c
Q12020 (122020 (132020 Q42020 Q12021 Q22021 Q32021 Q42021 Q12022 Q 2022 Q32022 042022
(YTD)
Count Of climate tech companies that went public decreased by + in 2022 YTD (Source: C [VC)")
Green Bond Fund. The Green Bond ETF seeks to track the investment results of an index composed of U.S. dollar-denominated investment-grade green bonds that are issued by U.S. and non-U.S. issuers to fund environmental projects.

You are also invited to follow my new LinkedIn newsletter on Green Edge and why we all need to take action to green our investment portfolios.
Green Edge newsletter on LinkedIn
Crypto Performance
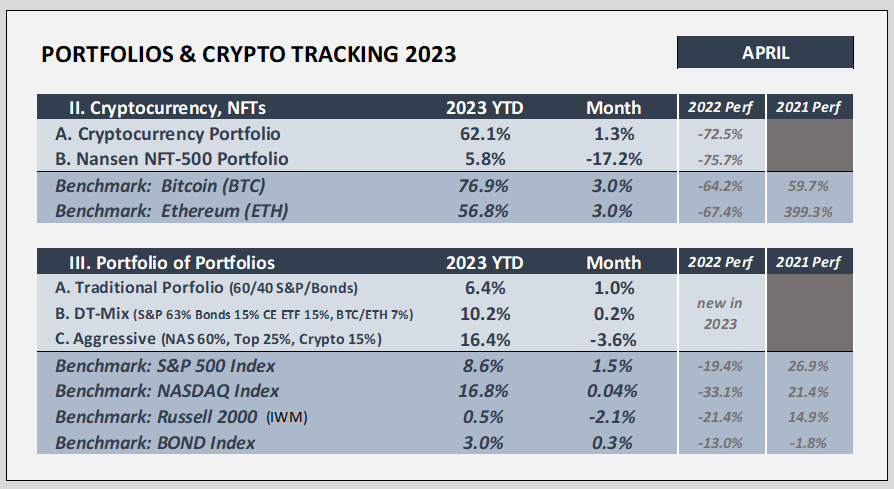
Cryptocurrencies held their own in April with both Bitcoin (BTC) and Ethereum (ETH) gaining 3.0% and the portfolio of cryptos up about half of that level at 1.3%.
On April 14th, BTC hit a high of $31,050, the highest level since early June of 2022. ETH’s high was $2,142 which it hadn’t seen since May of 2022. BTC didn’t stay over $30,000 for long as well as ETH over $2,000, which are psychological resistance areas. It is likely we see a retracement from these prices, perhaps back down to $25.3k for BTC and $1,700 for ETH. However, both continue to be in a bullish trend and anticipate higher prices in the intermediate term future.
For Portfolio of Portfolios results, the higher risk, the worse off the returns were for April. The Bond Index inched up 0.3% in April and is now up 3.0% for the year.
Thank you for joining me on this journey. Please invite others to join in as well.
Until next time. Efficiently Yours,
D.T.