

Is the Market Correction over?
Is the Market Correction over?
Green Edge Portfolio Performance for August 2023 (#34)

Last month I indicated that the market was ready for a rest after a significant run-up since January 4th. The 5-10% correction forecast was in the ballpark as the S&P 500 dropped -5.9% from 7/27 to 8/18 and the NASDAQ dropped -8.7% from 7/19 to 8/18. Since 8/18 the indexes already have recovered 65-80% of the correction.
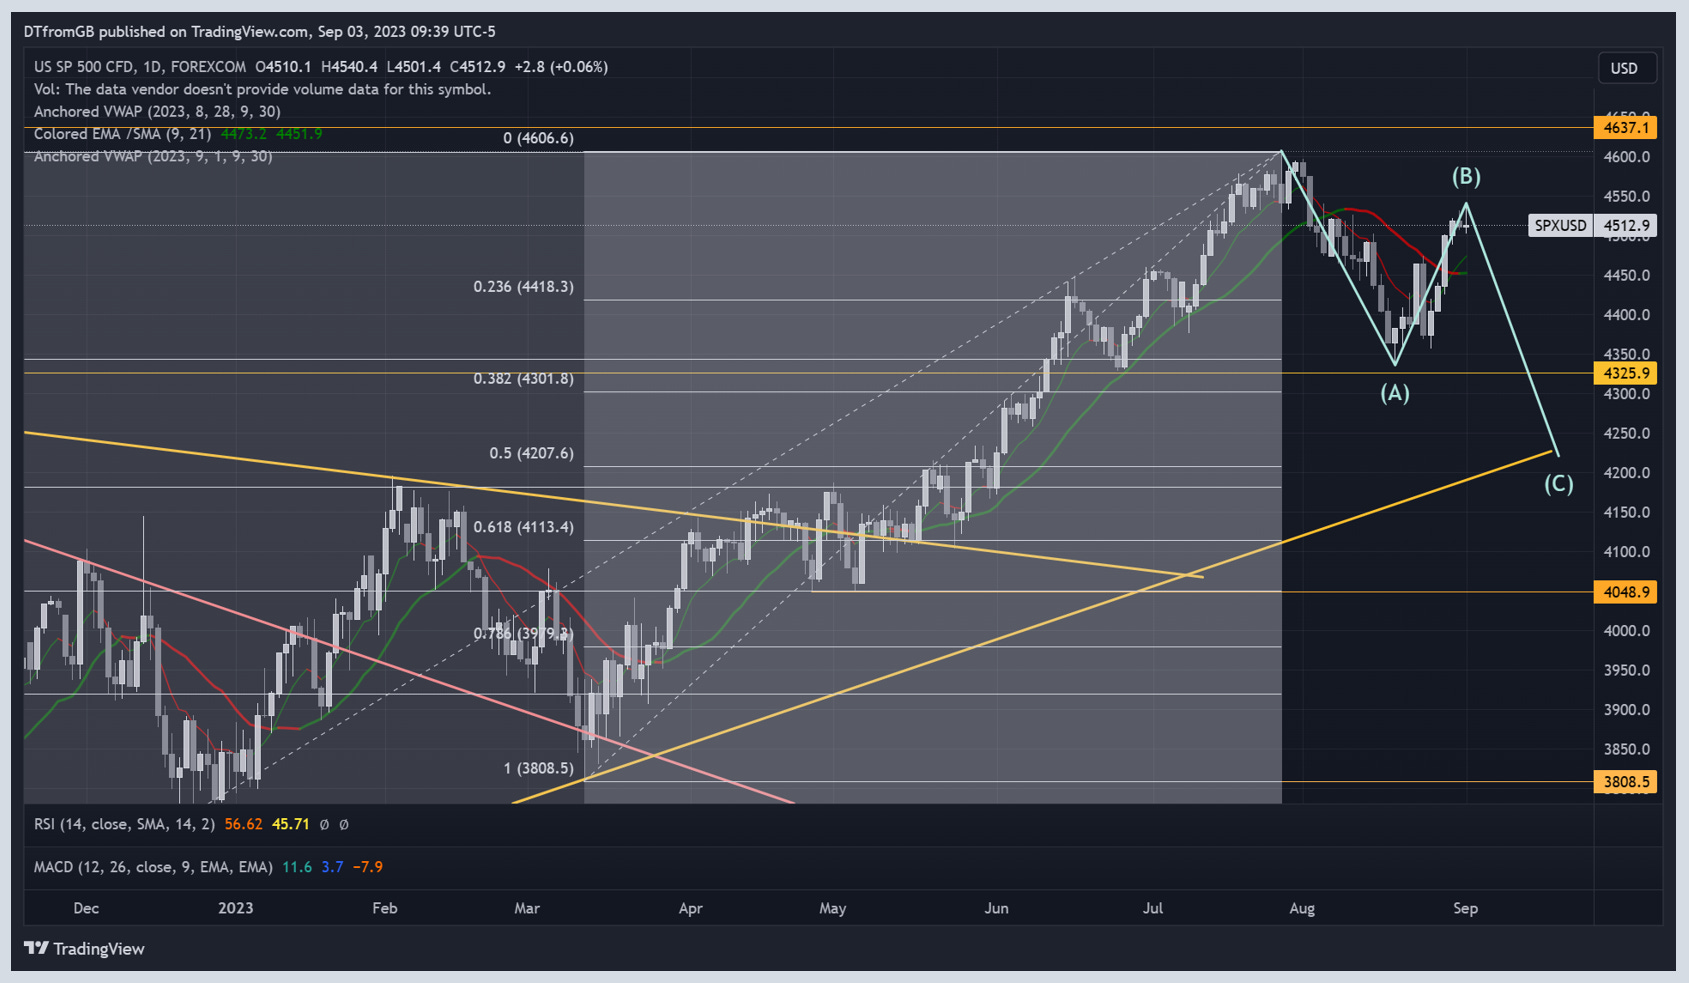
The question now comes down to whether that correction is over, and the markets move up to new 52-week highs and potentially all-time highs OR is there a third wave down in this corrective move. The latter may play out like the chart below where the SPX could test the 4,200 range (February highs and a 0.5 Fibonacci retracement), for a 6-7% decline. A move above 4,606 would eliminate the three-wave corrective idea.
Only time will tell. There is a lot of macroeconomic data that is providing somewhat conflicting information. Inflation is coming down, labor markets may finally be stalling, the consumer continues to spend, but student loan payments will restart in October, interest rates on the long side are creeping up making housing unaffordable as housing prices climb, and debate on the kind of “landing” => soft, hard, or none. However, the market doesn’t seem to care as it continues to push forward.
September is historically the worst performing month of stock returns. Since 1950, the S&P 500 has averaged a 0.5% decline during the month of September. This does not mean it will automatically be a down month, but with where the market is currently, I will be cautious over the next 4-8 weeks.
However, it is my belief that the market will hit new all-time highs during 2024 so I will look for opportunities to accumulate shares if we see lower prices.
If you are not yet subscribed, hit the easy button below.
Portfolio Update - August 2023
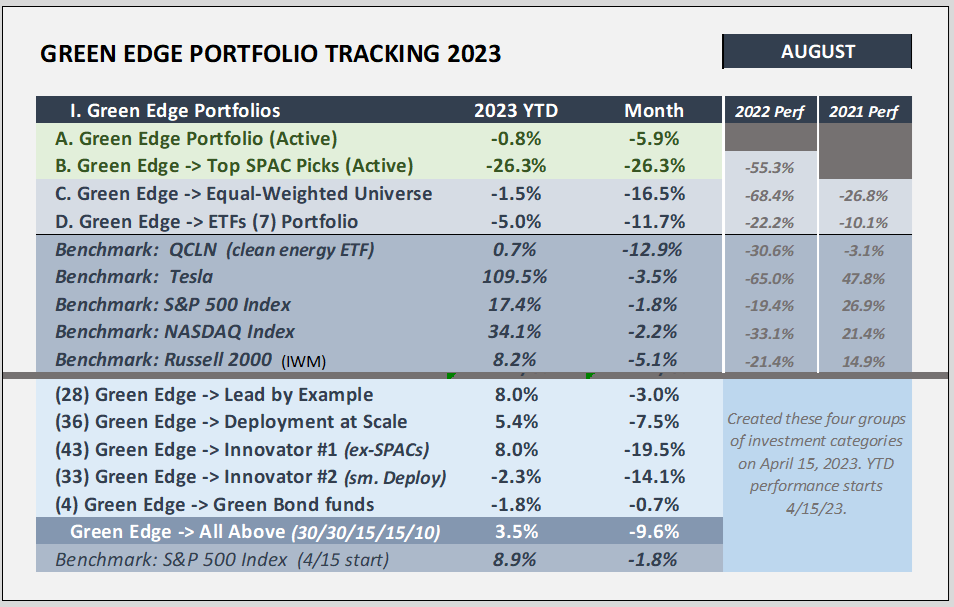
The markets set 52-week highs in late July and then sharply declined during the first half of August. Strength in the last six trading days of the month captured ~2/3 of the decline so the S&P 500 and NASDAQ indexes finished only slightly down for August at -1.8% and -2.2% respectively.
Small cap market ETF (IWM) Russell 2000 fell harder in the first two weeks and only got back half of the drop, closing down -5.1% for the month. Small caps had outperformed the broader market in both June and July but failed in this final summer month.
Clean energy ETFs performed even worse than Russell 2000, dropping over 20% from late July to mid-August and only clawing back one-third the drop, losing -11.7% overall (QCLN down -12.9%).
The top performing sector for August was XLE Energy up 1.7%.
Climate Tech Portfolios
The TAN Invesco Solar ETF declined -25.9% between July 18th and August 22nd. This timeframe coincides with Q2-2023 earnings reports and the general drawdown of the total market. Solar stocks were beaten down by less than rosy outlooks for the remainder of the year, especially for those companies serving residential solar market where high interest rates are slowing down sales.
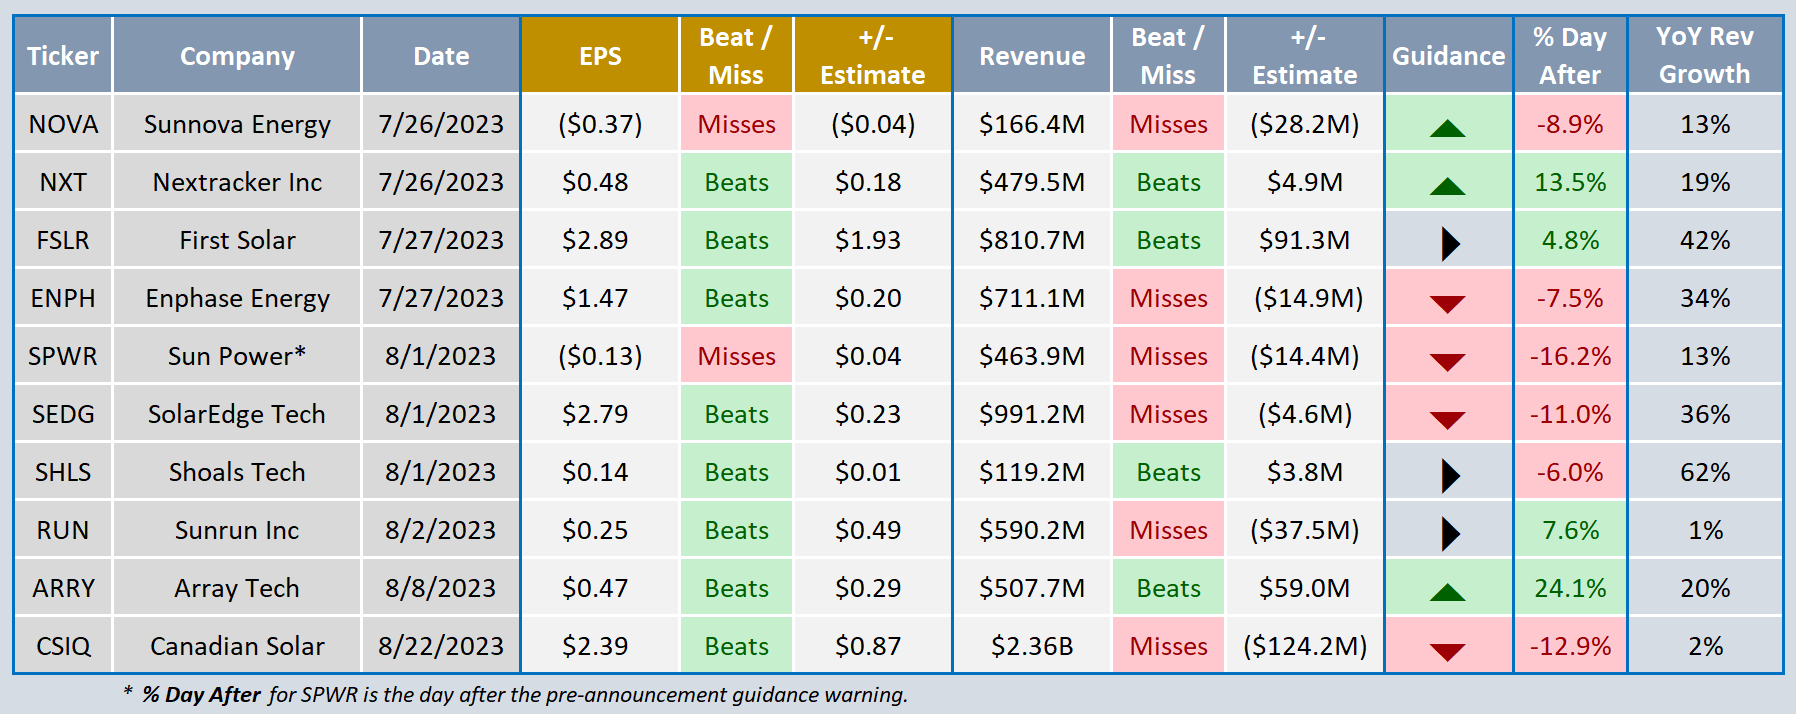
The updated table of solar stock quarterly earnings shows the “% Day After” earnings report performance. The Green-shaded rows are the companies that develop the large, utility-scale solar farms => Nextracker, First Solar, and Array. Sunrun is the only outliner as it surprisingly beat EPS for the quarter and moved up 7.6%. However, it lost 30% of share price in the two weeks after the Q2 report placing it in unison with the other residential focused stocks which are all in the Red.
But the Solar Industry is strong. In May, the EIA projected for 2023 that more money will be invested in solar energy than oil & gas for the first time ever, $380B vs $372B. More broadly, for every dollar invested in fossil fuels, about 1.7 dollars are now going into clean energy. Five years ago, this ratio was one-to-one.
Wood Mackenzie and the Solar Energy Industries Association reported 6.1 GW of solar was installed across the U.S. in Q1-2023, up 47% from a year earlier, and accounted for 54% of all new electricity generating capacity added to the grid during the quarter. Utility scale projects jumped up 66% YoY in the same time period.
The U.S. solar industry is forecasted to triple in market size by 2028, with 236 GW of new capacity expected in the next five years, growing to a total of 377 GW at the end of 2028. The incentives available for solar projects through the Inflation Reduction Act (IRA) is driving enhanced growth prospects throughout the industry, especially in the larger, utility scale projects.
As a “Leader” on Follow! — you can subscribe to the newsletter for a small monthly fee and follow the Green Edge portfolio. Check out Follow and find me there — CLICK HERE
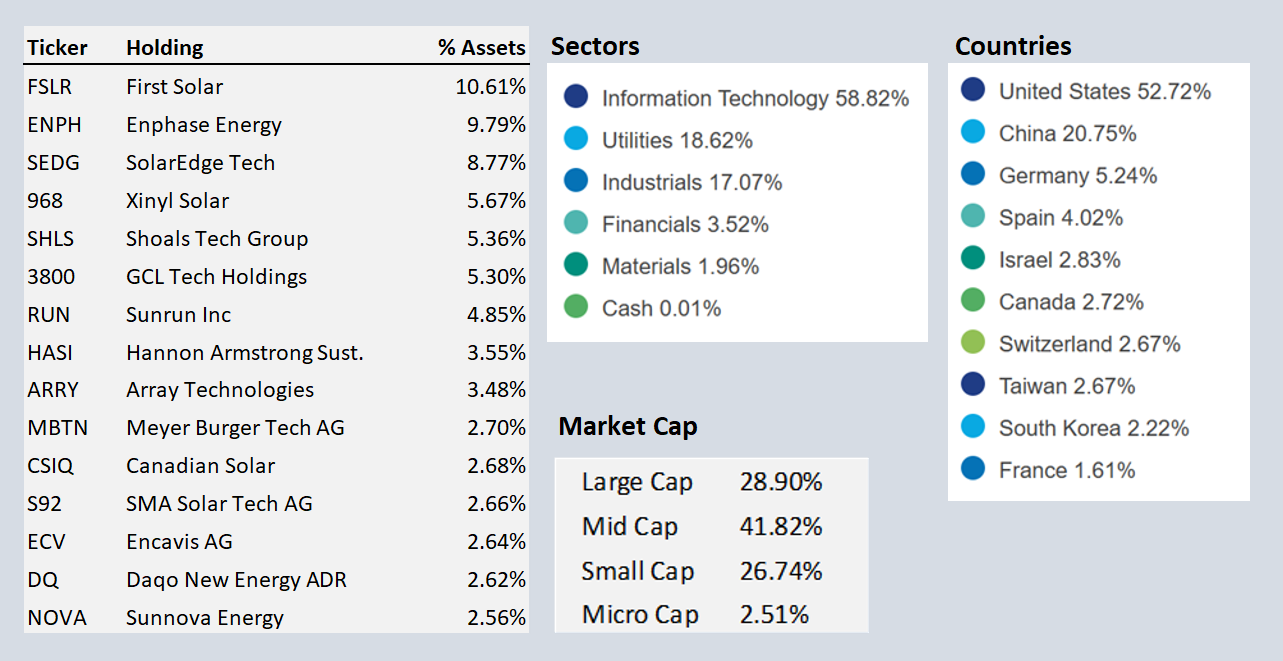
Perhaps the solar stocks are priced to perfection and any hiccup in the future growth trajectory hits these stocks hard. The TAN ETF has been a top 10 ETF performer over the past five years as it appreciated by 65% in 2019 and 233% in 2020 but has been relatively weak since that monster year in 2020. Below is some demographic information on the TAN ETF.
August News
ORGN Origin Materials ($1.37) dropped by -72% in two days after it announced delayed construction schedule and a much higher capital budget for Origin 2 of $1.6B compared to the original $1.07B aggregate capital budget estimate provided in February 2021. Closed the month at $1.37.
EOSE EOS Energy received a $398.6 million loan commitment on August 31st from the U.S. Department of Energy to expand its manufacturing capacity. On the news, Guggenheim Partners upgraded EOSE to a BUY from a previous rating of Neutral and set a price target of $10 per share. The stock was up over 50% in the pre-market on Friday and closed at $3.85, up +18.5% for the day.
MP MP Materials ($20.94). JP Morgan initiates coverage at overweight with a price target of $27.
PTRA Proterra said Tuesday, August 8th that it had voluntarily filed for protection under Chapter 11 of the U.S. Bankruptcy Code in the District of Delaware. Shares closed down -88% on Tuesday.
The list of clean energy SPACs that have reverse stock splits continues to grow this month with SUNL Sunlight Financial 20/1, FFIE Faraday Future 80/1, and HLGN Heliogen 35/1 added. This strategy is usually done to keep the stock above $1 per share so it can continue to trade on a main exchange. It is not good news and wouldn’t own any of these companies.
Cryptocurrency Performance
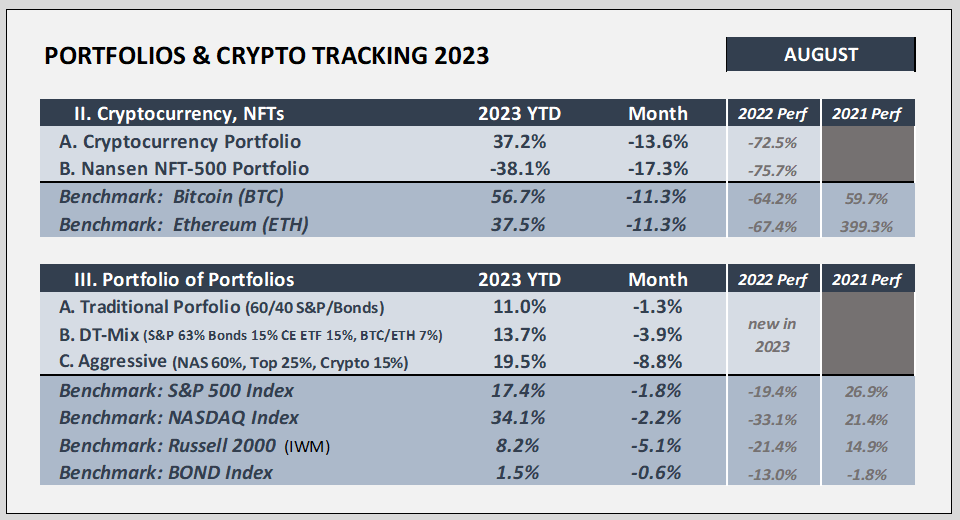
Both Bitcoin and Ethereum closed the month of August down -11.3% while the broader portfolio basket finished down -13.6%. Bitcoin’s YTD returns are still a strong 56.7%. NFTs continue to plummet down -17.3% for the month and -38.1% YTD.
Last week, the US Court of Appeals for the District of Columbia Circuit ruled in favor of Grayscale, ordering the SEC to set aside its earlier rejection of Grayscale’s application and reopen the review process.
The court ruled that there was no justification for the SEC to allow Bitcoin futures-based ETFs but deny spot Bitcoin ETFs.
On this news, Bitcoin price rose by 6.2%, or over $1,600, to $27,700. Most of this gain was lost during the next two days as the SEC seeks to delay action.
Portfolios
August was a ‘risk-off’ month, so it is no surprise that the more conservative, traditional 60/40 portfolio outperformed the more aggressive portfolios as it was down only -1.3% compared to -3.9% for the Mix and -8.8% for the Aggressive. The bond index was down -0.6% as interest rates rise.
I’ll be heading off on a two-week+ vacation in September and step away from the market. Please do what you can to hold up prices while I’m gone. :-)
Efficiently Yours,
D.T.