

It's May. Should you sell & go away?
It's May. Should you sell & go away?
April 2024 Portfolio Performance results

You have likely heard the adage “Sell in May and go away” meaning that the price action between May and October is historically weak and you might as well not play. Instead, go out, touch some grass, and get away from the market.
First of all, past performance is not a guarantee of future results, so please ignore this kind of rhetoric. However, it is fun to dig in, so let’s look at the past three years - with charts!
In 2023, if you sold on May 1st and bought back on October 31st, you would have missed out on a … wait for it ... 0.71% gain. :-) Sell, stay, it didn’t matter.
There was, however, a 10.6% gain between 5/1 and 7/27 and then a loss of 10.9% between 7/27 and 10/27. I guess one could say that you would have made your life much easier not experiencing the whipsaw price action, but hey, why not keep a little spice in your life.

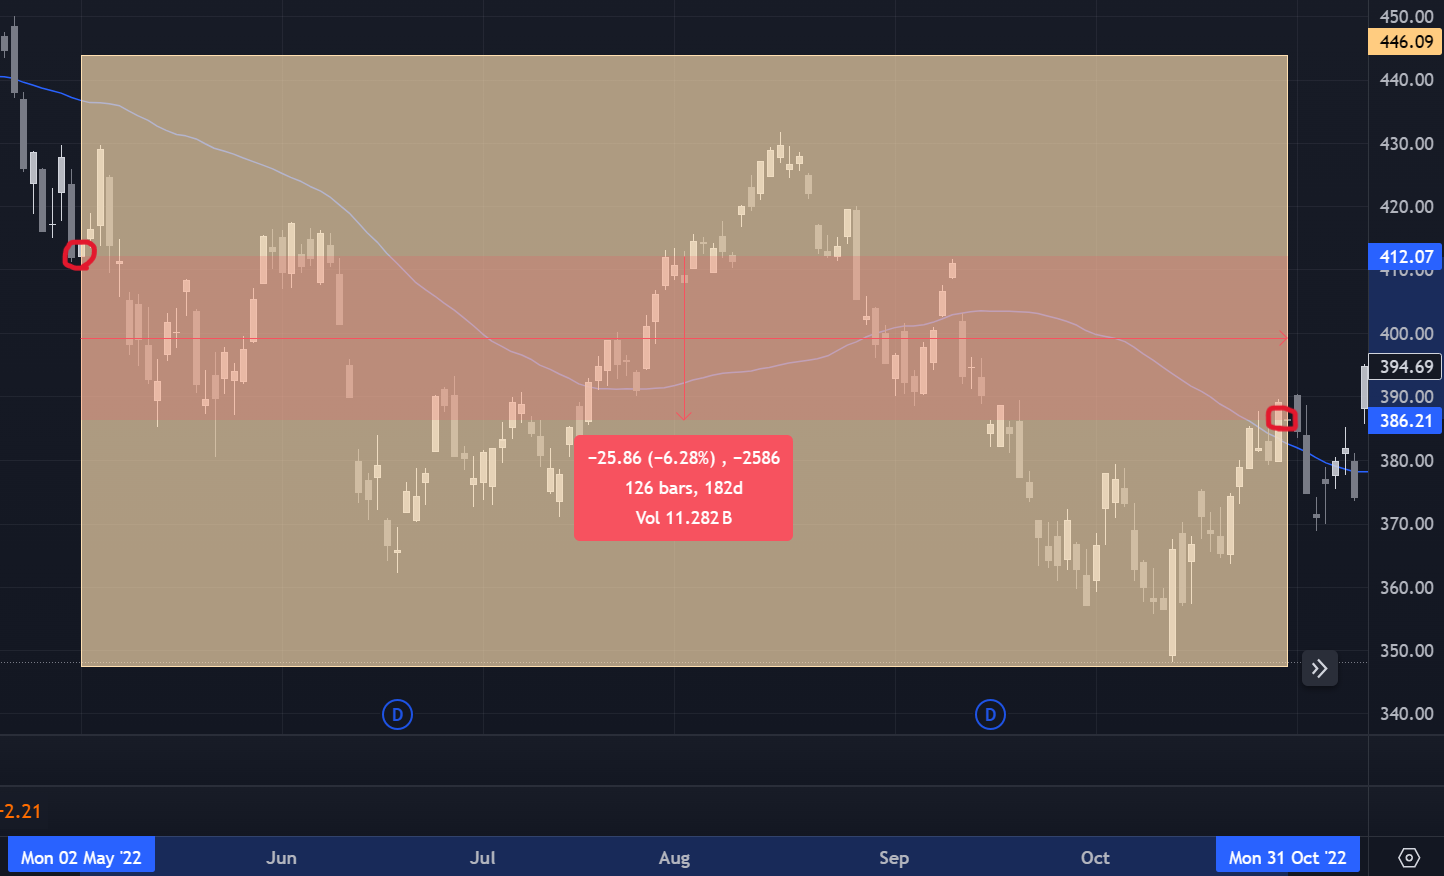
Checking in on 2022 charts, there was a loss of -6.28%, but 2022 was down over 20% for the whole year, so you would have been better off not being in the market at all the whole year. There was a nice 18% rally between June 16th and August 16th → you get these even in bear markets.
One more. Calendar year 2021 was a bullish year and the market performed very well between 5/1 and 10/31, up +10.6%. It was a beautiful trend from beginning to end. The S&P was up 27% for all of 2021.

In summary, don’t sell, don’t go away, sit tight, dollar cost average in, and enjoy your summer. Let’s look in closer at the action for April.
General Market Commentary

The market took a much-needed break during April with the S&P Index down -4.2% and the NASDAQ as down -4.4%. The S&P had gained 28% since the end of October 2023 with no more than a 2% drawdown in the past five months. Equal-weighted S&P500 and the small cap Russell 2000 got hit harder losing -5.0% and -7.7%, respectively. With the exception of the Russell, all indexes maintained positive returns year-to-date.
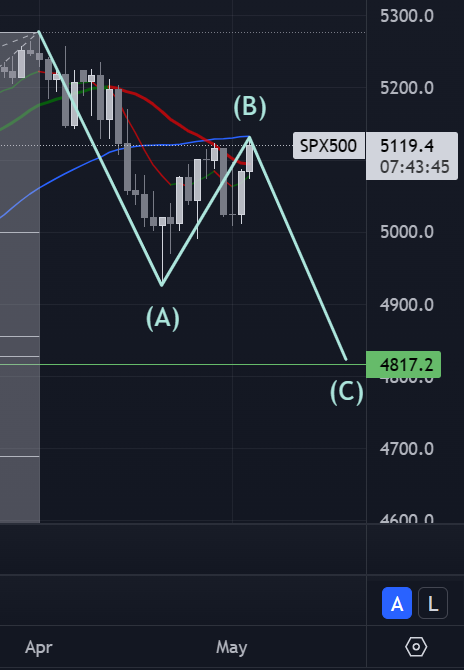
The total correction from the S&P high on March 28th (5,277) to the low on April 19th (4,925) was -5.86%. Is this enough to call it the correction and time to go back up or will we have one more turn down. Many corrections do come in three waves, so one more push to a new interim low is possible, but certainly not guaranteed. A target of 4,800, or about 9.0% total correction is an area to watch, if it does turn down (note: I’m fully invested and not playing a potential ‘C’ wave).
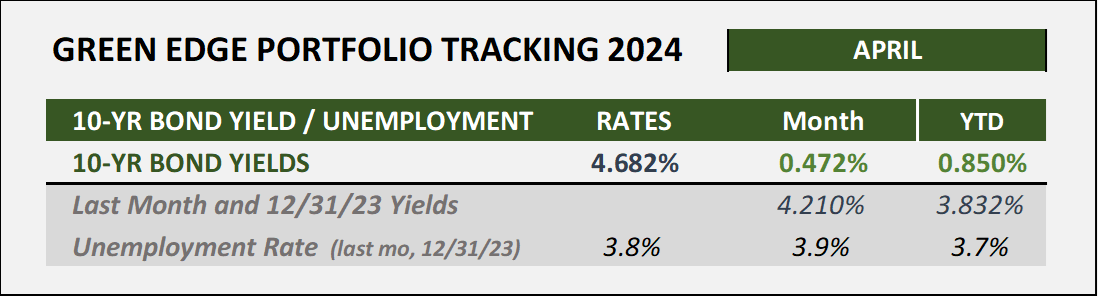
Interest rates moved higher during April putting pressure on stock prices with the 10-Year bond yield up 0.472% in April to 4.682%, the highest rate since October 2023, which was the highest since 2007. This has particularly hurt the small caps, again.
Two fears for investors:
Inflation sticks around so that the Fed might have to raise rates instead of cutting. Three months ago, 6 cuts were priced into the market. Today, it is one.
NEW fear. With GDP growth coming up short of expectations last quarter (1.6% vs 2.4%) and inflation being sticky, the fear of Stagflation has appeared recently.
Stagflation is characterized by both high inflation and stagnant economic growth, which presents a unique challenge for policymakers, and has not been historically friendly to stock prices.
The May 1st FOMC meeting maintained the current Fed Rate (not down, not up, but just right). Fed Chair Powell commented that the data is not supporting a cut yet, but he did say he thought a rate hike would be very unlikely. On the topic of Stagflation, Powell said “I don’t see the Stag, nor the Flation.” He is quite the jokester. Hope the future data supports his words.
Clean Energy Performance Tracking Table
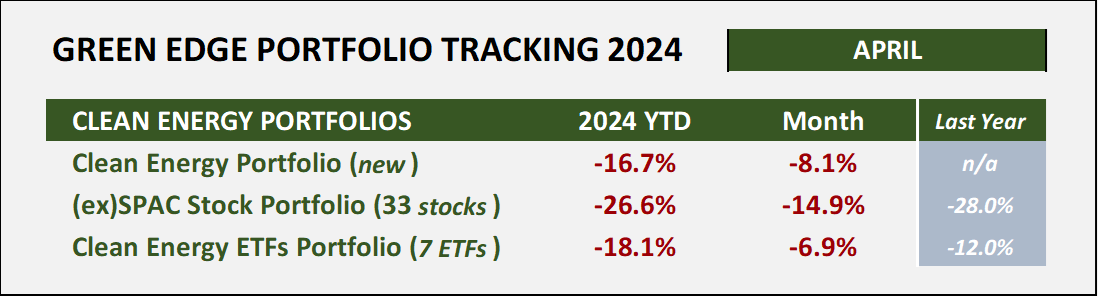
The basket of Clean Energy ETFs dropped -6.9% in April while the Green Edge Clean Energy portfolio dropped nearly twice that of the S&P500, down -8.1% —> both in line with the Russell 2000 loss as “higher for longer” interest rates continue to hamper the “low cap, need more money to grow” type companies.
Let’s take a closer look at EV leader, Telsa as its stock price has been pressured all year. From a high on December 28, 2023 ($263), it had lost -47% of value by April 22, 2024 ($138). As the calendar approached the Q1 earnings report on April 23rd, the stock fell over -20% in 10 days on fears of slow demand, margin pressure, and a rumor about not pursuing the new low-cost model by focusing exclusively only on robotaxis.
Although Telsa missed on both earnings and revenue (not a surprise), there were positive reports on Full-Self Driving (FSD) demand, a new deal in China to make FSD available there too, and confirmation that it did that close down its efforts for a low-cost model. The stock rallied +11% the next day and has continued higher rallying +43% over four days to as high as $198.87 before pulling back and ending of the month at $183.38, +4.3 for April.
The results for our Green Edge Groups are shown below. The large cap, Lead by Example group, is outpacing the S&P500 YTD, +7.0% vs. +5.6%.
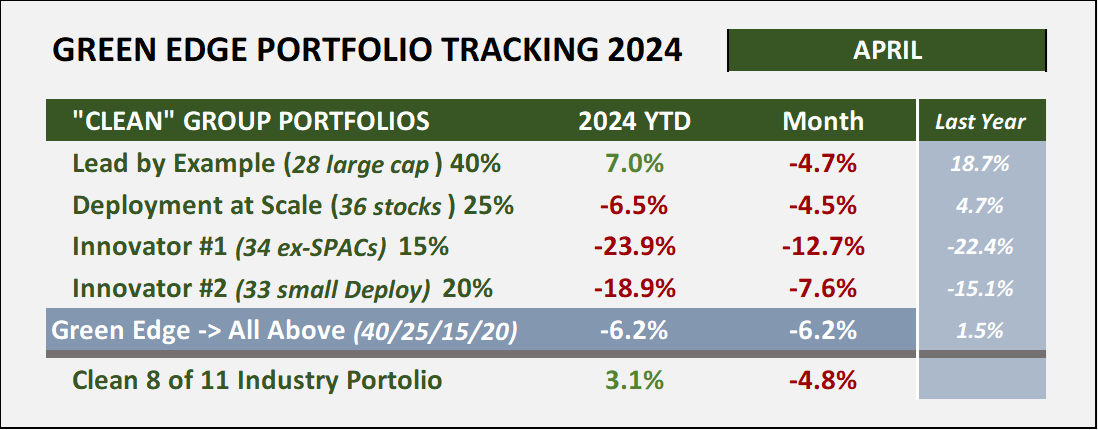
Our clean “8 of 11” industry approach (no materials, energy, or utility) is trailing the S&P500 +3.1% vs. +5.6%.
The small company, ex-SPAC companies continue to struggle as many are pre-revenue, or at least pre-profit, need to continue raising money for operations, new manufacturing facilities, and/or to build out their teams. It is not only expensive, but very difficult, if not impossible, to raise funds for these types of companies in this environment. Some will come through and make it big. Others will die on the vine into an acquisition or bankruptcy (I’ve pointed out many of these over the six months). This group of companies lost -12.7% for the month and is down-23.9% YTD.
Cryptocurrency Portfolio

After a raging first quarter of 2024 in the crypto market, the month of April became a rest period. Well, maybe more than a rest, as Bitcoin dropped -18.7%, Ethereum down -20% and our crypto portfolio down -22.5%. However, the returns are still strongly positive YTD up +37.1%, +27.9%, and +24.9%, respectively.
The fourth bitcoin halving occurred on Friday, April 19, 2024, at a little after 8:09 p.m. Eastern, dropping the issuance rate of new bitcoin by 50% (half) to 3.125 roughly every ten minutes. The price of Bitcoin at the time was about $63,000. Bitcoin closed the month at $58,000.
It is normal, if you consider the first three times enough data for trend analysis, for the price of Bitcoin to correct downward after a halving. However, in the previous three times, price has accelerated strongly peaking 12-18 months after the halving. For example:
In the last halving in May 2020, price went from about $10,000 up to almost $65,000 by April of 2021.
In July of 2016, the price at halving was about $650 and moved up to almost $20,000 by December of 2017.
In the first halving during November of 2012, the price of Bitcoin was about $13 per BTC. By December of 2013, price almost hit $1,000.
The rate of change is smaller with each halving as price extends upward. In the last halving price appreciated by ~6.5x. If this factor drops by more than half to only a 3x, that could still mean that Bitcoin hits a price of $190,000 during 2025.
Have a Wonderful May.
Efficiently Yours,
D.T.