

Picking the Top
Picking the Top
February 2024 Portfolio Performance results

The S&P (SPX) has moved up in 16 of the last 18 weeks hitting all-time highs on the week of February 26th close at 5,141.
Last month I wrote that we had run so hard that we might need a breather and be in for a 5-10% correction during the second half of the February. Well, that didn’t happen, but it still feels like a correction is needed. The problem with picking tops (or bottoms) is that the market like to trend. You are much better off staying in the market and not trying to “sell the top” or “buy the bottom” as it almost never happens. I say this from experience.
Example. If you are waiting to buy when we have a 10% correction, the index may go up 15% before you get that correction to buy. And when the market is down 10%, it is very hard to make that purchase because it feels like the end is near as everyone is bearish. No way does one actually buy at that bottom. This is the mental game that the market plays with you, if you are trying to beat it, and it usually wins.
In the few weeks, I’ve slowly been more conservative in my portfolio by increasing levels of cash and added a short position (using SQQQ which is a 3x leverage short on the QQQs) to hedge the rest of the holdings. My cash balance has edged up to almost 25%, from a normal 10% of the portfolio, and have accumulated about 10% in the short position. By making these moves, my portfolio is about 1-2% of portfolio value lower than if it would have stayed fully invested.
My recommendation is to not play the game of picking the top. So why did I do it? I guess it gives me something to write about in this newsletter. Or maybe it because I think I’m smarter than the market (famous last words). Or maybe, just maybe, I’ll be right in March and get back to even. Then I can sound smart on X (ex-twitter). But most likely, I’ll be trailing the index again as “the market only goes up”. Right?
Let’s get into the discussion.
General Market Commentary

February was a strong month for the stock market with the S&P 500 and NASDAQ up +5.2% and +6.1%, respectively and +6.8% and +7.2% year-to-date. Both indexes hit all-time highs this month with SPX moving over 5,100 level to 5,111.06 and the NQ going over 16,000 to 16,134.22. Since the lows in late October 2023, SPX has gained over +24% while the NQ has appreciated +28% these past four months.
Equal-weighted and Russell 2000 both trailed the core indexes but still gained +4.0% and +5.0%, respectively. With this gain, the Russell moved into positive territory YTD.
Artificial Intelligence (AI) has driven this new bullish wave. Nvidia (NVDA), the star of the show, makes the computers for data centers that need huge compute capability for running AI activities. NVDA has gained over 450% in the past 14 months and now has a market cap of over $2 trillion, the third largest company behind only Microsoft and Apple.
News after the close on March 1st was that high-flyer Super Micro Computer (SMCI) will move into the S&P 500. SMCI, another company in the AI space, had been the largest market cap stock in the Russell 2000 but will certainly be removed in the next annual reconstitution. SMCI was up 269% in 2023 calendar year and has rocketed another 209% in January and February plus it is up about 15% in after-market hours upon the announcement of inclusion into the S&P 500 on Friday after close => a total of about 1250% gain in 14 months.
Will the AI-fueled tech rally continue to push markets up in the next few months? It is a very strong trend that will have impact in nearly all industry segments over time.
Clean Energy Performance Tracking Table
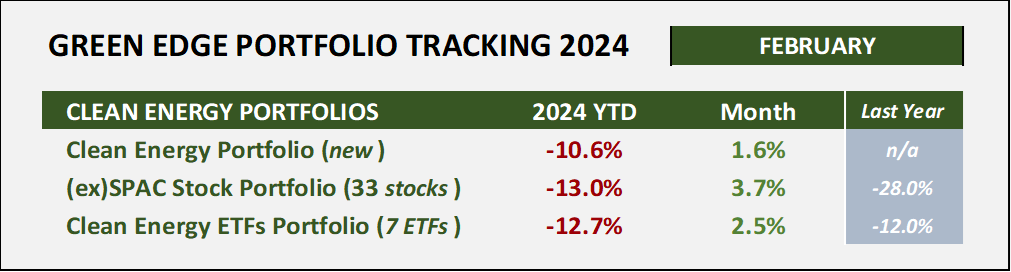
The clean energy ETF portfolio is a good benchmark for the clean energy publicly traded market. This portfolio of seven clean energy ETFs gained +2.5% in February after a disastrous January performance. The group of 33 ex-SPAC stocks jumped up +3.7% in the month, while the new 2024 clean energy portfolio gained +1.6%.
February was the peak of earnings season for Q4-2023. For the market as a whole, earnings for the S&P 500 were up 4% quarter over quarter. However, in the company-by-company announcements, earnings calls brought surprises => both to the upside as well as the downside. Here are some examples for our clean energy holdings.
Solar Edge (SEDG) missed on revenue and gave a less than rosy guidance for next quarter’s revenue that led to a -22% drop from $84 to $66 per share. MP Materials (MP) dropped almost -10% from $16 to $14.50 as they missed on revenue and shared their frustration with the market price of rare earth minerals. EV truck automaker Rivian (RIVN) lowered their production estimate for 2024 and were clobbered for a -34% loss from $15.50 to $10.00. SEDG, MP, and RIVN are all holdings in the 2024 Clean Energy Portfolio.
On the other hand, First Solar’s (FSLR) earnings and guidance were viewed positively by the market as it gained +10% to almost $160. Enphase Energy (ENPH) reported earlier in the month and provided an upbeat forecast leading to a +30% gain in stock price back to $130 per share. Hyliion (HYLN) moved up nearly +50% when they announced that the company’s strategic shift to wind down powertrain operations and focus on our KARNO generator is on track. Much less cash burn and a focus in a successful product.
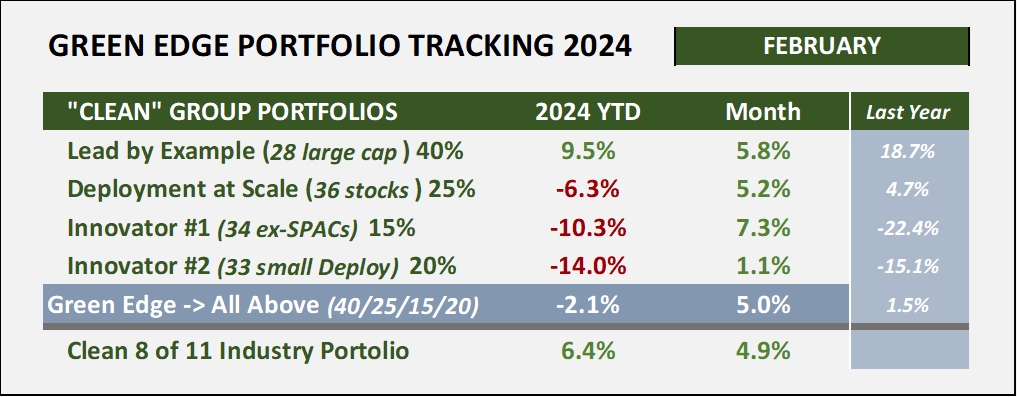
In the Green Edge Groups portfolio, the Lead by Example group is beating the S&P index by +2.7% YTD. The Deployment at Scale and Innovators groups were green for February but still negative since January 1st. The 8 of 11 industry portfolio (leaving out the dirty sectors of energy, materials, and utilities) was up +4.9% for the month and +6.4% YTD, short by 0.4% of the S&P YTD growth.
Cryptocurrency Portfolio
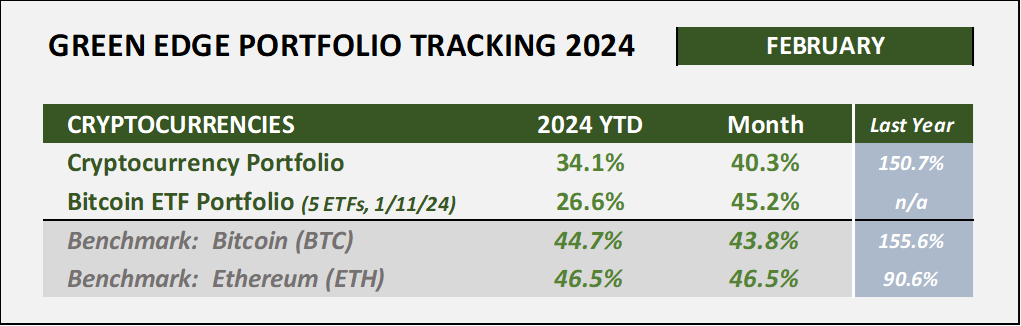
The SEC approved Bitcoin ETFs on January 10th which gives investors an easy way to hold Bitcoin in their portfolios. After only six weeks of operation, there are five new Bitcoin ETFs with over $1 billion in assets each. The largest is Blackrock’s iShares Bitcoin trust that has attracted over $10 billion of inflows. Fidelity, Proshares, ARK, and Bitwise round out the list.
I purchased some ARKB in my 401k on day one of availability, January 11th, and built a position over three weeks (avg of $45.50 per share). On that first day, it was issued at a value of $50 per share, hit $52.22 as a high that day, and then closed at $46.76. A low of $38.62 happened on 1/23/24, but with Bitcoin closing February above $60,000, ARKB closed the month at $62.28, up +24.5% since inception.
Bitcoin miners produce 900 BTC per day which will be reduced to 450 BTC per day after the halving in late April (the bitcoin code reduces the amount of BTC issued by half every hour years). The new ETFs are generating about 10,000 BTC of demand which has been the main driver for pushing up the price and will likely test all-time high at $69,000 in March.
Have a wonderful Springtime.
Efficiently Yours,
D.T.
Note to subscribers. You can follow the 2024 Clean Energy Portfolio on Savvy Trader at:
https://savvytrader.com/DTfromGB/top-clean-energy-stocks-portfolio?s=NTM2MTo0NDYy