

Super Bowl of Stocks
Super Bowl of Stocks
January 2024 Performance Update (Month #39)

HAPPY SUPER BOWL SUNDAY! (Hopefully you aren’t reading this on a Sunday, but really needed to get this edition out). Who are you picking?
Well, my first 2024 prediction went down the tubes already in January. The Green Bay Packers did not make it to the Super Bowl. But after a couple weeks out from our loss to the San Francisco 49ers, I’m happy for the season Jordan Love, Packers QB, gave us.
The 49ers and the Chiefs are in Super Bowl LVIII and making it a rematch of the 2020 Super Bowl LIV game in which the Chiefs beat the 49ers 31-20 in Miami. The game was the last NFL game played before the COVID shutdown about six weeks later. My wife is a big Mahomes fan, so we will be cheering for the Chiefs, who are 2.5-point underdogs at the moment, up from 1.5 points after the conference championship games. Did you know that this is the week of the year when searching for roman numerals hits it peak?
In other prediction news, my S&P Index chart for 2024 showed a run-up to about 5,050 before a 5-10% correction in the March timeframe. The index closed at 4,845 on 1/31 but has moved to over 5,026 as I finish the write up of this newsletter.
P.S. Sorry for the tardiness this month but needed to update all charts and created a few new metrics to track for us. I’ve tried to simplify the performance tables this year to make it easier to take in the information.
Let’s get into the commentary and performance.
General Market Commentary
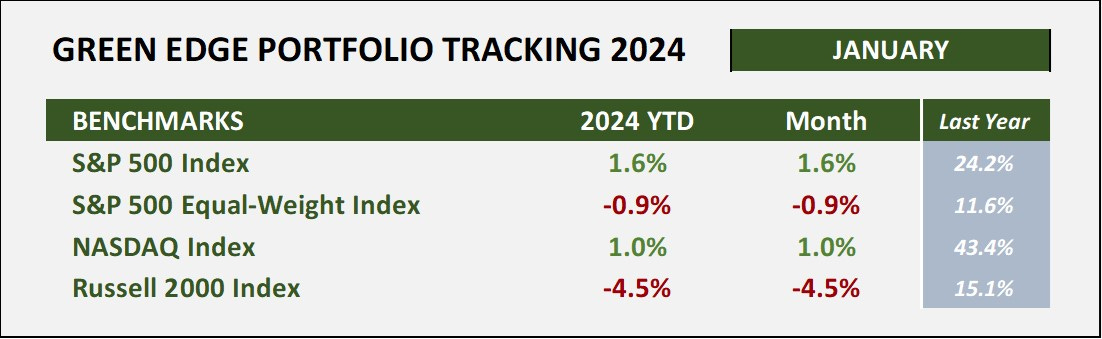
The S&P and NASDAQ indexes were both up in January +1.6% and +1.0%, respectively, after a slow start in the first two weeks of the year. However, the small cap index, Russell 2000, finished to the downside by -4.5%.
In 2023, the “regular” (market cap weighted) S&P 500 Index returned more than twice the Equal-Weighted S&P Index +24.2% vs. +11.6%, respectively, due to the astronomical returns of the Magnificent 7. This same result continues into January of 2024 as the equal-weighted underperformed by 2.5%, losing -0.9% during the month. I’ve added the equal-weighted index to our benchmarks so we can track and watch each month.
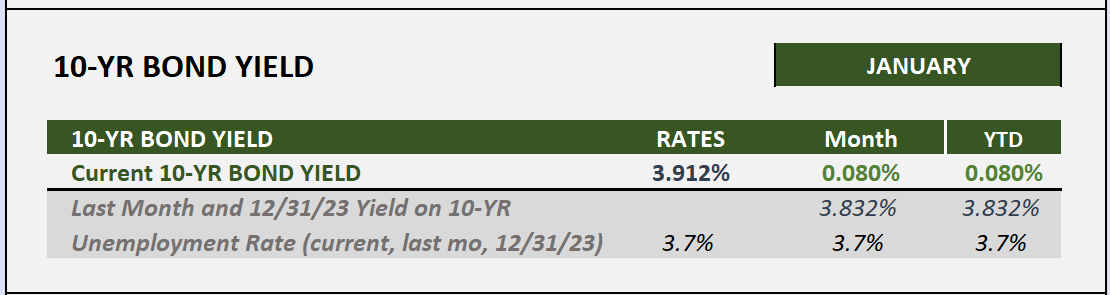
During the month, the 10-YR bond yield rose 0.08% to 3.912%. We will keep a close eye on interest rates and the Fed activity this year. Federal Reserve Chair Jerome Powell was interviewed on 60 minutes last weekend saying that the Fed’s job of beating down inflation is not done yet, but that the data is moving in the right direction. He mentioned that they would continue to evaluate and could have rate cuts this year. Of course, the market is projecting six rate cuts. In anticipation of lower rates, the market has gained over 20% since the end of October 2023.
Clean Energy Performance Tracking Table
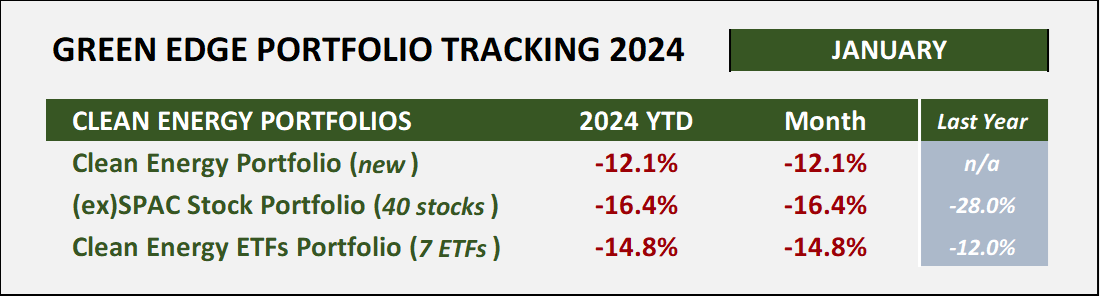
Clean energy stocks were a sea of red in January (I know, what’s new?). The baseline Clean Energy ETF portfolio was down almost -15% in the first month of the year and our basket of 40 stocks that emerged from the SPAC bubble in 2020-2021 were down -16.4%.
As a recap, the Clean Energy ETF portfolio finished down -12.0% last year versus a gain of +24.2% in the S&P Index.
As I mentioned late last year in this newsletter, I created a new Clean Energy Portfolio that is not just ex-SPAC companies. It performed 2.7% better than the ETF portfolio, likely because the funds are not fully deployed yet, so it contains about 25% cash. Below is the list of the initial 11 companies included in this new portfolio. During February, the cash will be deployed either into either new stocks or add into the selected holdings.
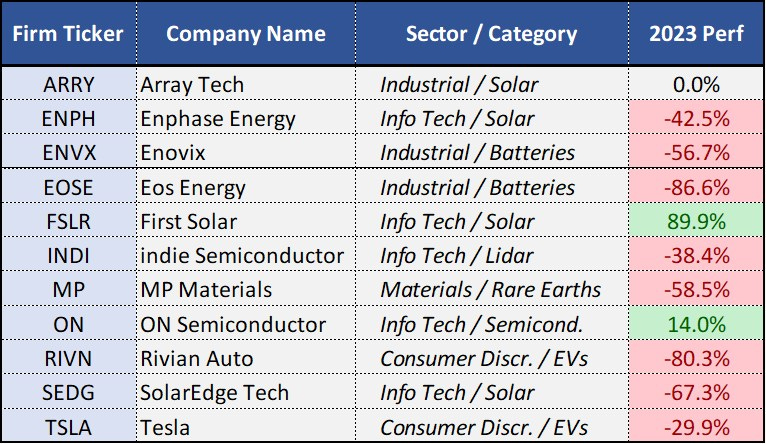
The third column shows the industry sector that each company is included and the clean energy category. The portfolio is allocated across a number of clean energy categories including Solar (4), Batteries (2), Electric Vehicles (2), Mining (1), and Semiconductors for clean energy purposes (2) (i.e. Power solutions and Lidar for autonomous vehicles). I may look to add a fuel cell company such as PLUG or FCEL. Since the portfolio has room for a couple more companies, if you have any suggestions, send them over to me.
The fourth column exhibits the stock returns for the 2023 calendar year. ARRY is not a mistake, it actually closed at exactly the same price as it began the year. Only two of the stocks were positive in 2023, FSLR +89.9% and ON +14.0%. Loses were as bad as down -86.6% for EOSE. Four of the eleven companies did come public through SPACs: ENVX, EOSE, INDI, and MP.
Insight. In past editions, this newsletter has mentioned the soft market for residential solar primarily due to rising interest rates. Recently heard some numbers on the effect of the higher rates which I thought really drives this point home. Since renewable energy projects are heavy on Capital Expense (CapEx) and light on Operational Expense (OpEx), the cost of capital, or financing (interest payments) make up a greater share of the total cost of project as interest rates rise.
For example, a solar project that has a 4% cost of capital, the cost of financing would make up about 25% of total project cost. At a 12% rate, the financing portion of the project cost jumps to 60%. Therefore, these types of projects become highly sensitive to interest rates.
Opportunity. If you feel that interest rates will move lower over the couple of years and the economy will not go into a recession, revenues for solar companies could make a nice comeback in that scenario. The solar ETF ticker TAN was down -26.9% in 2023 and another whopping -20.6% in January. Since its all-time high in January 2021, price of the ETF has dropped -67%. Has it hit bottom? (note: TAN gained +233% in 2020).
I look forward to diving in deeper on these companies and industries during the year and will share right here in this newsletter.
Green Edge Groups Portfolio
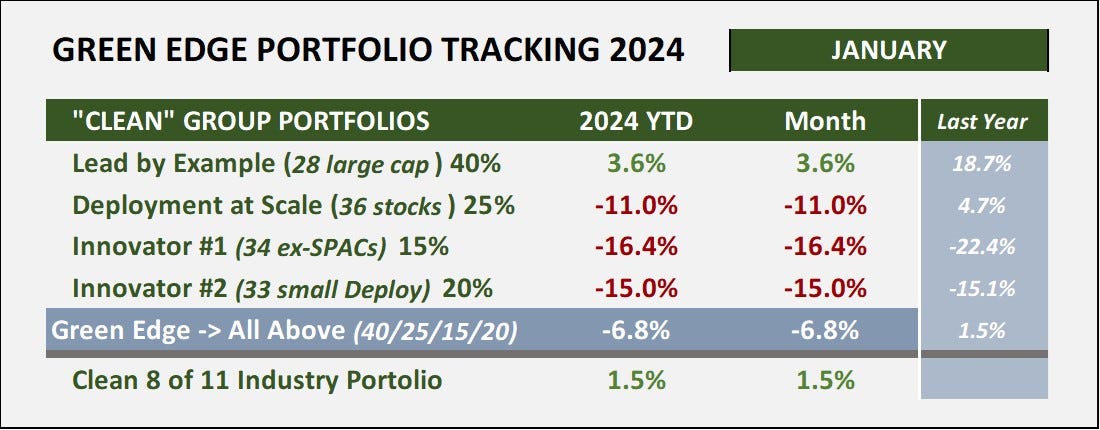
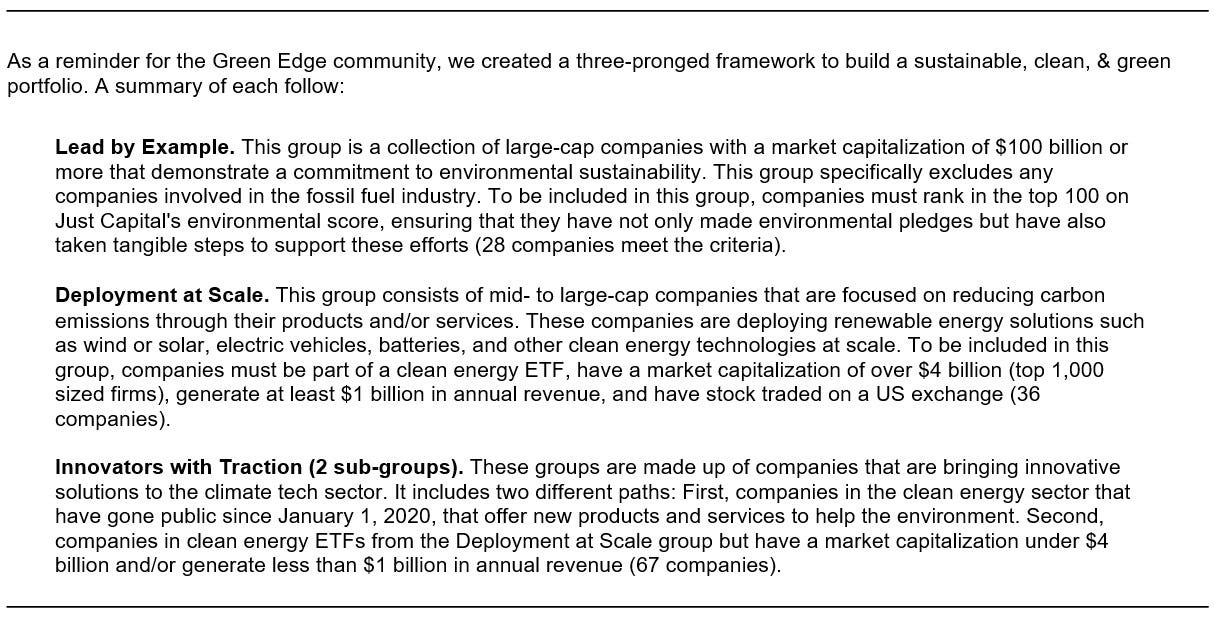
Last April Green Edge brand came alive and created three groups of “clean” investment sectors: Lead by Example, Deployment at Scale, and Innovators with Traction. The percent performance for the “last year” column was actually April 15, 2024 to December 31, 2024 (versus calendar year). The idea is to invest into these clean categories to create a more diversified portfolio than only clean energy companies. The lead by example is large cap companies that are implementing sustainable practices into their businesses. This group gets a 40% allocation of the portfolio funds as of 1/1/24. See the description below as a reminder of these groups.
We will continue to track this portfolio throughout the year. If you would like a list of the companies, please reach out to me at DTfromGB@gmail.com.
8 of 11. Every public company in categorized into one of 11 industry groups that include energy, materials, industrials, consumer discretionary, consumer staples, health care, financials, information technology, communication services, utilities, and real estate. In my research last year, you can reduce the carbon emissions of your portfolio by 60% if you invest in 8 of 11 sectors, leaving out the three dirtiest ones. By re-allocating funds from energy, materials, and utilities into the remaining eight sectors, we create the 8 of 11 portfolio. In January, this portfolio performance was nearly the same as the 11 of 11 (the S&P Index) at +1.5% return for the month. We will continue to track performance and report monthly on this clean investment strategy.
Please share this edition on your socials or with family & friends by clicking the share button above. Next month we will hit the 40th month of insightful, and sometimes painful, tracking of clean energy publicly traded stocks.
Have a great February. 50-degree days in Wisconsin. Is Global Warming all that bad?
Efficiently Yours,
D.T.