

Three-Year Anniversary
Three-Year Anniversary
Green Edge Portfolio Performance for October (#36) =>>> 3 Years!!!!

This Edition marks the three-year anniversary of this newsletter. It was easy in the beginning. Clean energy stocks going public via special purpose acquisition companies, or SPACs, with stock prices escalating on the announcement of the target company. Then when the reverse merger happened, the stock rallied again.
The first ticker I bought was SPAQ, Spartan Energy Acquisition, who had announced that the EV automaker, Fisker (FSR), was their target. My first buy was at $13.30, bought more on a dip to $9.03 and sold some at $16 and more at $21. It hit a high of $31.96 in March of 2021.
Quantum Scape was a crazy ride. I got in around $19 in September of 2020. Sold some at $30, more at $53 and $79, and my last runners at $121. It hit $132 on December 22, 2020. My problem was buying “dips” on its way back down. I thought $40-60 was cheap in spring of 2021. Today QuantumScape trades at $6.09 and Fisker at $4.55. Sadly, these two are performing better than most clean energy SPAC stocks.
Of the 80+ companies I’ve tracked every month for the last three years, only two are above the $10 original price => MP Materials at $16.42 and Enovix at $10.59. I had such high hopes for companies like ChargePoint, the largest level 2 EV charging company, which now trades at an unbelievable $3.17 (my average cost is above $10). And Proterra, EV bus manufacturer, who is now operating under bankruptcy protection with a stock price of $0.07.
I’ve stuck with it, writing every month, and sharing my research and the portfolio performance in the hopes of helping others (and myself). The distribution list grew 4-5x early on and has plateaued, but still get over 50% open rate which is good for newsletters. Thank you for hanging in there with me. I do feel that the thesis of the clean energy transition over the next decade is huge and there will be some big winners. As we approach 2024, I will likely extend the portfolio into all clean energy companies and not limited to ex-SPAC issues. At least it will give me a chance to beat the indexes again.
Have a wonderful Thanksgiving. Enjoy your time with your families. Ok, let’s look at the results. Oh brother…
Portfolio Performance Table & Discussion

October marked the third straight month of negative returns in the indexes, which hasn’t happened since early 2020 (Covid shutdown). We didn’t even have three negative months in a row during the 2022 bear market. And it’s so fun writing a newsletter with minus signs all over it. :-)
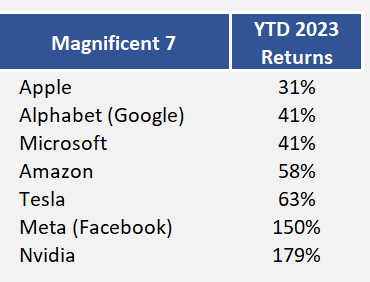
S&P 500 index lost -2.2%, the NASDAQ was down -2.8%, and the small cap Russell 2000 was the big loser, dropping -6.9%. As of October, the Russell 2000 is now negative year-to-date at -5.6%, while the S&P 500 holds its head above water at +9.2% and the tech heavy NASDAQ remains the top gainer at +22.8%. Note that the S&P 500 Equal Weighted ETF is down -3.8% for the year. This ETF invests equally in all 500 companies whereas the regular S&P 500 index is based on market cap. The returns of the Magnificent 7 stocks have been what’s keeping the market into positive overall territory. See their returns below. If these are not in your portfolio, you are likely trailing the market returns.
Santa Claus Rally Incoming?
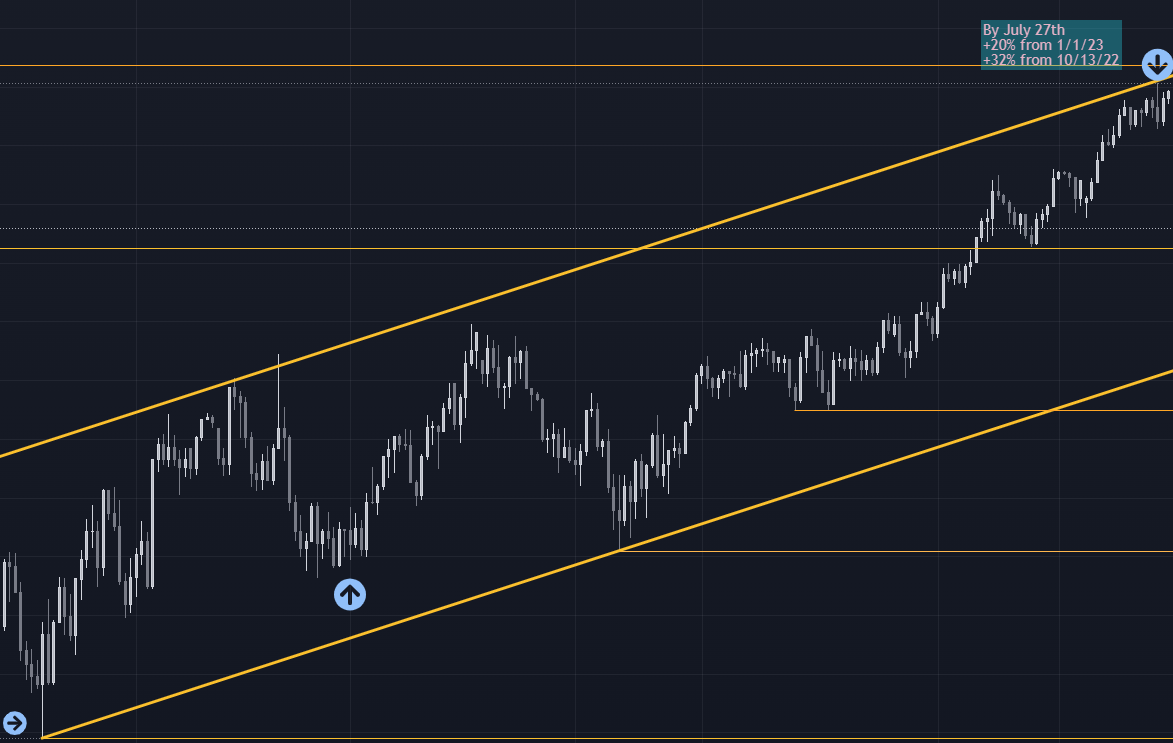
With two months left of 2023, it seems like a good time to take stock in where the stock market has come so far and where it could be going. The chart below starts with the S&P 500 low made on October 13, 2022, at 3,490. There was a strong bounce through November and early December before closing out 2022 at 3,845, up 10% from the low.
The trend channel continued with strong price action through July 27, 2023, hitting a high of 4,606, up almost +20% from 1/1/23 and +32% from the October low. At this point, the S&P was less than 5% from the all-time high made on January 4, 2022 (reminder that the annual return for 2022 in the S&P was minus -19.4%).
But August, September, and October have been brutal losing -11.7% from July 27 high to October 27 low (-13.1% for NASDAQ and -18.6% for Russell 2000). You can tell a bear market from the charts because you have a series of lower lows (pink arrows) and lower highs (green arrows). Since I’m writing this on November 4th, look at what has happened this week (Oct 30 to Nov 3) => a gain of 6.6%.
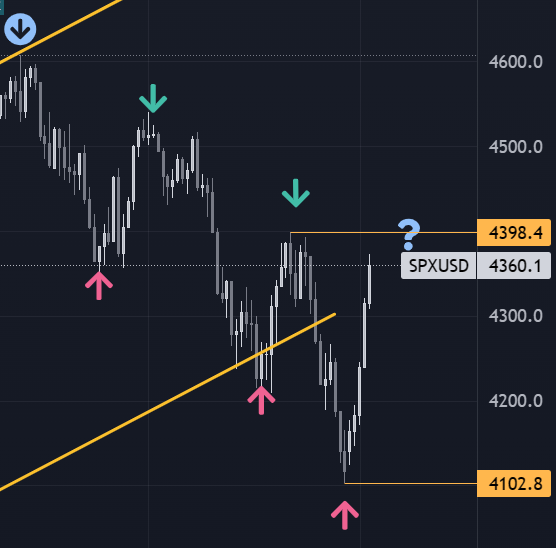
This next week of price action is pivotal (blue question mark) as we are on the cusp of changing the bearish trend and making a new higher high over 4,400. Or will we turn around and head back down towards 4,000 which would give us another lower high?
What to watch for this week: a daily close above 4,398 and the bulls take control for a run towards all-time highs. Stop short and turn lower, the S&P will likely take out the last lower low at 4,102.8. Let’s all cheer for the former.
Clean Energy Discussion
I shared this post/chart on X (twitter) showing the difference in YTD returns between the S&P 500 Index and the Global Clean Energy ETF, ICLN. There is a 42% underperformance in the clean energy sector as compared to the index.

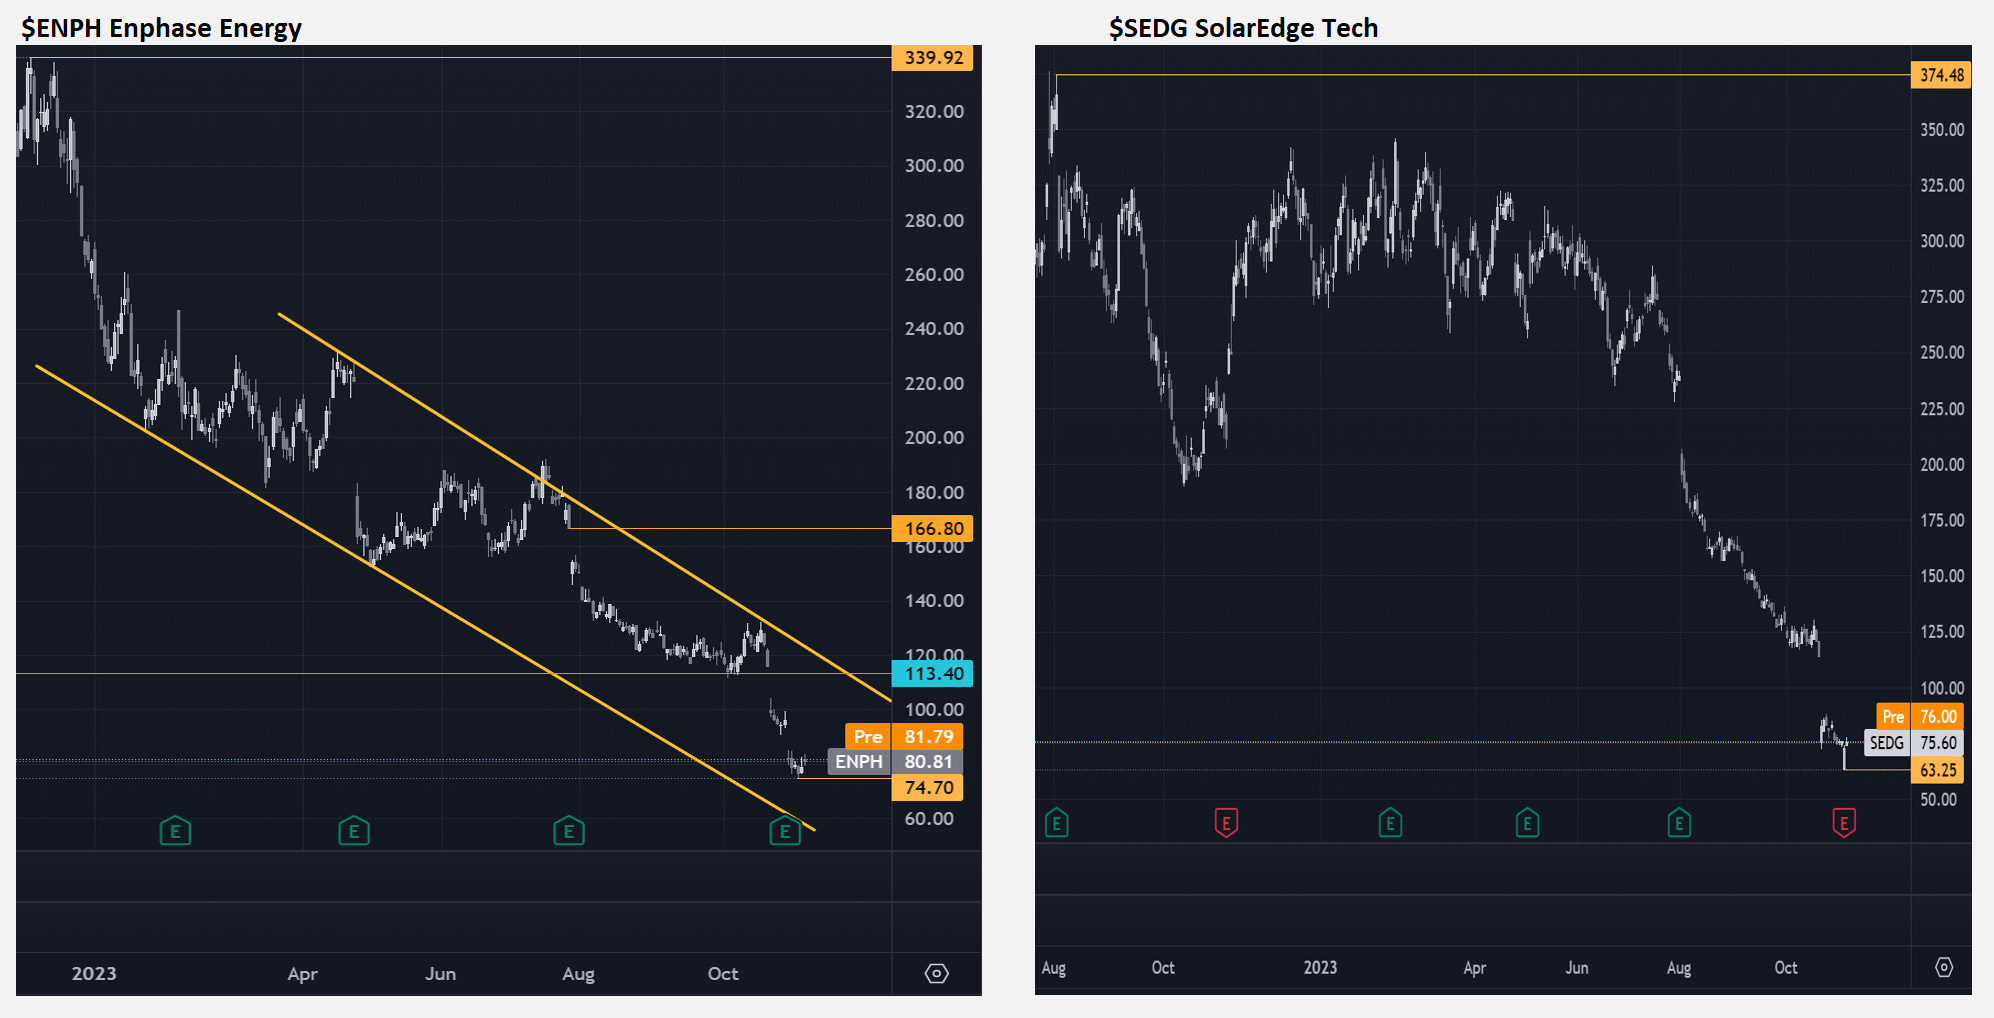
Residential Solar industry is one of the core drivers to this underperformance. For example, let’s look at two high flying solar company stocks, which are included in nearly every clean energy ETF, Enphase Energy and SolarEdge Technologies.
Enphase stock price rose from $22 in the Covid low March 2020 to almost $340 by December 2022, for a 1445% gain. However, in each of the last four quarters, stock price has been slaughtered by missed results and lower guidance. ENPH is down 78% in the past 10 months. SolarEdge’s Covid low hit $67 and it appreciated to almost $390 by November of 2021, up 482%. And was still in the $370s in August of 2022, but it too has not met expectations. The stock price has now moved below its Covid low to $63, down 83%.
The stock market doesn’t like surprises and punishes companies that provide negative news. In the Q3 reports last month, poor Q4 forecasts were provided by both companies leading to single day losses of 15% and 27%, respectively. Enphase said it expects revenues of $300M-$350M for Q4, far below $579M analyst consensus estimate. SolarEdge guided for revenues of $300M-$350M, far below $715.1M analyst consensus estimate. These estimates for the next quarter are half of the market’s expectations. Not good.
Higher interest rates are killing customer demand for residential solar systems. In addition, a new rule that changes the rate California utilities will pay for kilowatt-hours from solar has been reduced. The European economies are also in poor condition as consumer spending slows. It feels like most investors did not comprehend how negative the effect of high interest rates would be on residential solar systems.
For small growing companies, like most of the clean energy companies coming public through SPACs, the higher interest rates are making it harder and more expensive to raise capital to keep operations afloat. Hence, we have seen a number of bankruptcies and a concern from investors whether these companies can weather the storm and remain solvent.
When these companies came public, the initial price of the stock was $10. Of the 73 companies that started on my clean energy SPAC list this year, nine have fallen off in either mergers or bankruptcy. For the remaining 64, nearly half are valued under $1 per share and only two are above the beginning price. Here’s the breakdown:
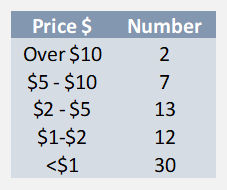
Hence, why in 2024 this newsletter will expand its view to all clean energy stocks. Wish I could include privately owned companies as there are some really interesting innovations being taken on by start-ups in the clean energy space as the world moves towards a transition for fossil fuels to cleaner technologies over the next 10, 20, 50 years.
Cryptocurrency Performance
Let’s take a quick look at the cryptocurrency markets. As war broke out in Israel, there was a move towards precious metals and bitcoin. Bitcoin prices have roughly followed the NASDAQ market over the last few years as it seemed to be considered a “risk” asset. But October of 2023, we saw decoupling of the prices between the two. This was also news that some applications to the SEC for a Bitcoin ETF are moving forward and may be approved in the next few months.
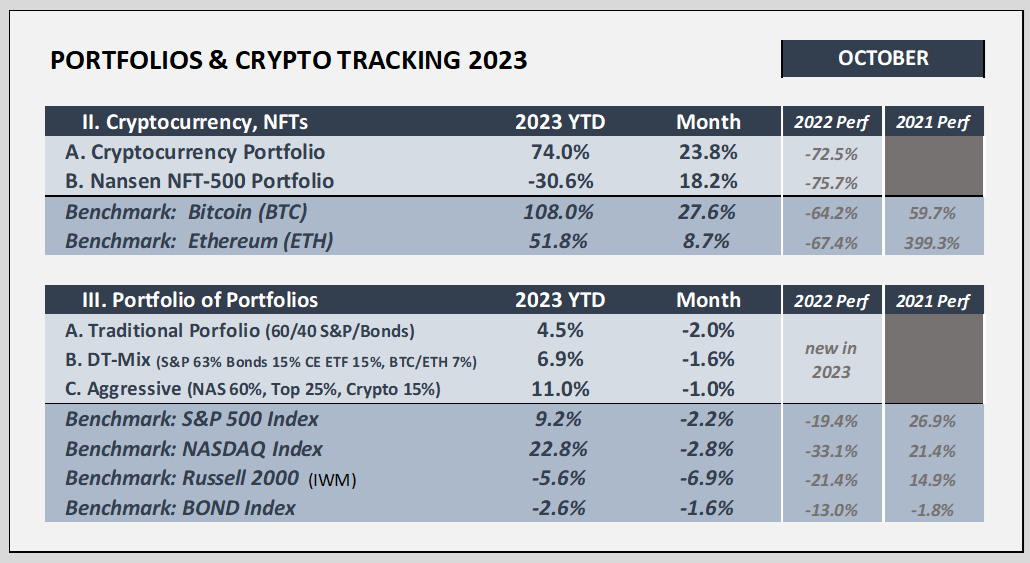
Bitcoin moved up +27.6% in October and is now more than double the price since the beginning of the year. Ethereum gained +8.7% last month and +51.8% for 2023. Our cryptocurrency portfolio was up 23.8% for the month. Solana was the big winner, up 79% for the month.
Again, thank you for your support over these last 36 months. Please reach out to provide any input or suggestions as we move forward for the next year.
Efficiently Yours,
D.T.