


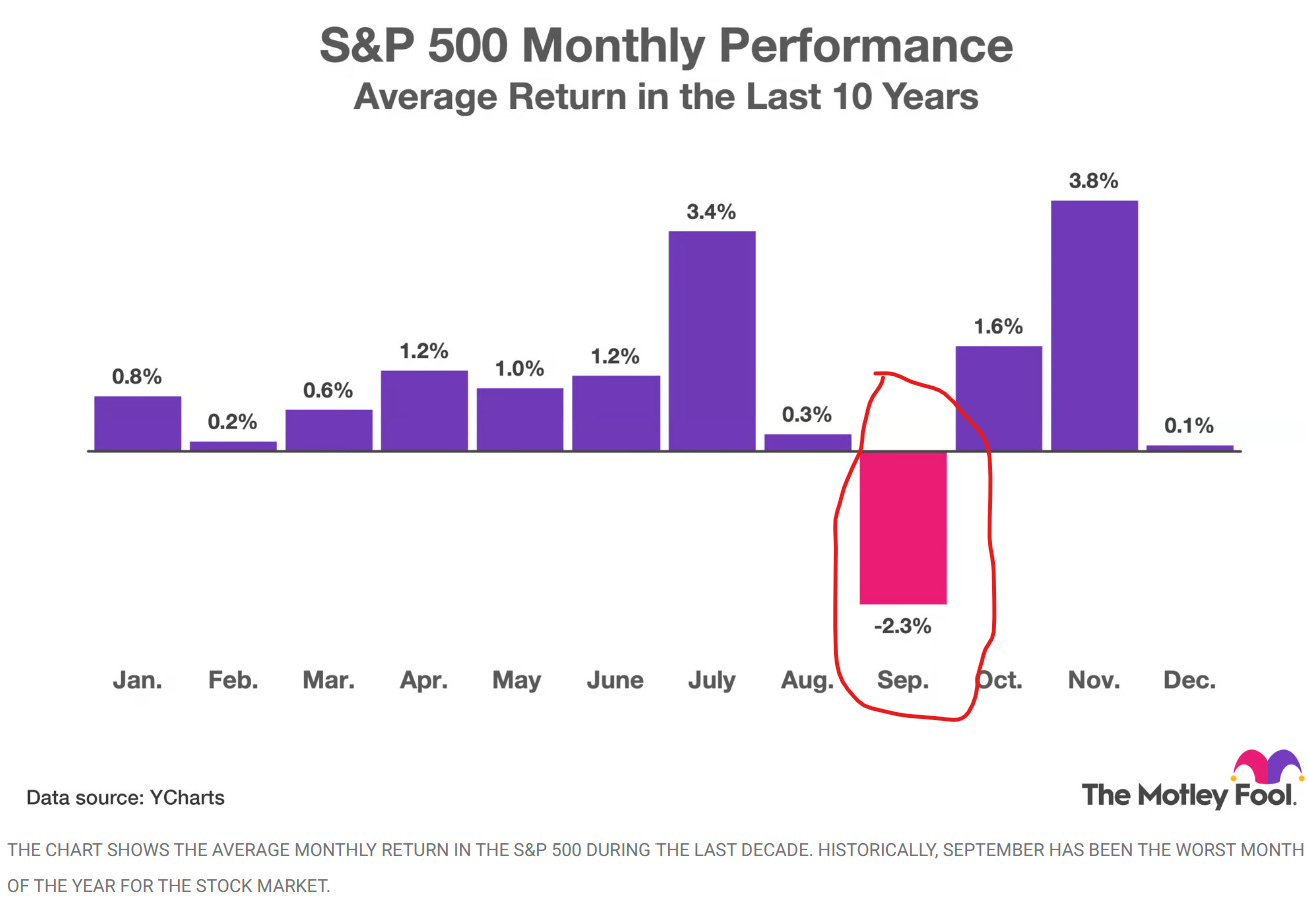
I love the fall, and September in Wisconsin has got to be the best weather month of the year. Fall sports of football and soccer get started —> you can smell it in the air. However, September has not been good historically for the stock market. Since 1928, the market has lost traction 56% of the time with an average loss of -1.2%. The recent decade has been even worse, 70% and -2.3% (see chart).
But this is an election year, so things can be different. Looking back since 1928, there is a slight advantage of a positive month in September (13 times out of 24) or 54%, although the average move is actually down -0.2%. If we narrow the focus to the most recent 11 elections since 1980, seven of those, or 63% are positive.
What to do with this info? Nothing. Continue to execute your plan as this is just one month in a long series of months. If you are investing new money, maybe hold for a couple weeks. November is among the best of performances, so don’t sell long-term investments now.
August Takeaways:
Historically, odds are that September will be a negative month, but anything can happen in any single year, especially in an election year.
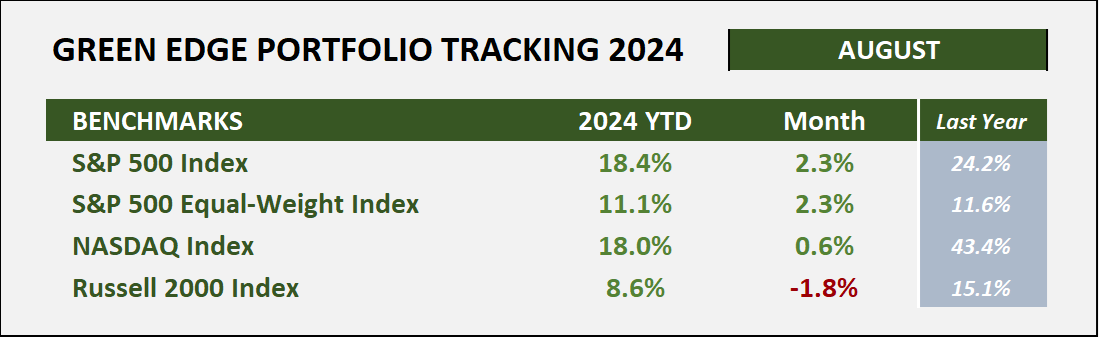
August was a tale of two markets:
down 7-10% in the first three trading days (and a total drop of 10-15% since mid-July), then
recovered nearly the whole correction by the end of the month with the S&P500 only 0.3% away from all-time highs.
Equal-weight S&P hits all-time highs → is this a signal of things to come?
Clean energy stocks lose ground in August with the ETFs down -1.9%.
Crypto markets are ice cold with Bitcoin down -11% and Ethereum losing -22%.
General Market Commentary
Interesting to note that as the market rebounded strongly from the early August correction, the S&P500 is just short of all-time highs (by 0.3%) while the Equal-weighted S&P is almost 2.5% over the previous highest close (July 16th). This is the broadening of market participation that we have been wanting to see. There is a good chance that the equal-weighted index will continue to outperform in the next 12 months against the market-cap index.
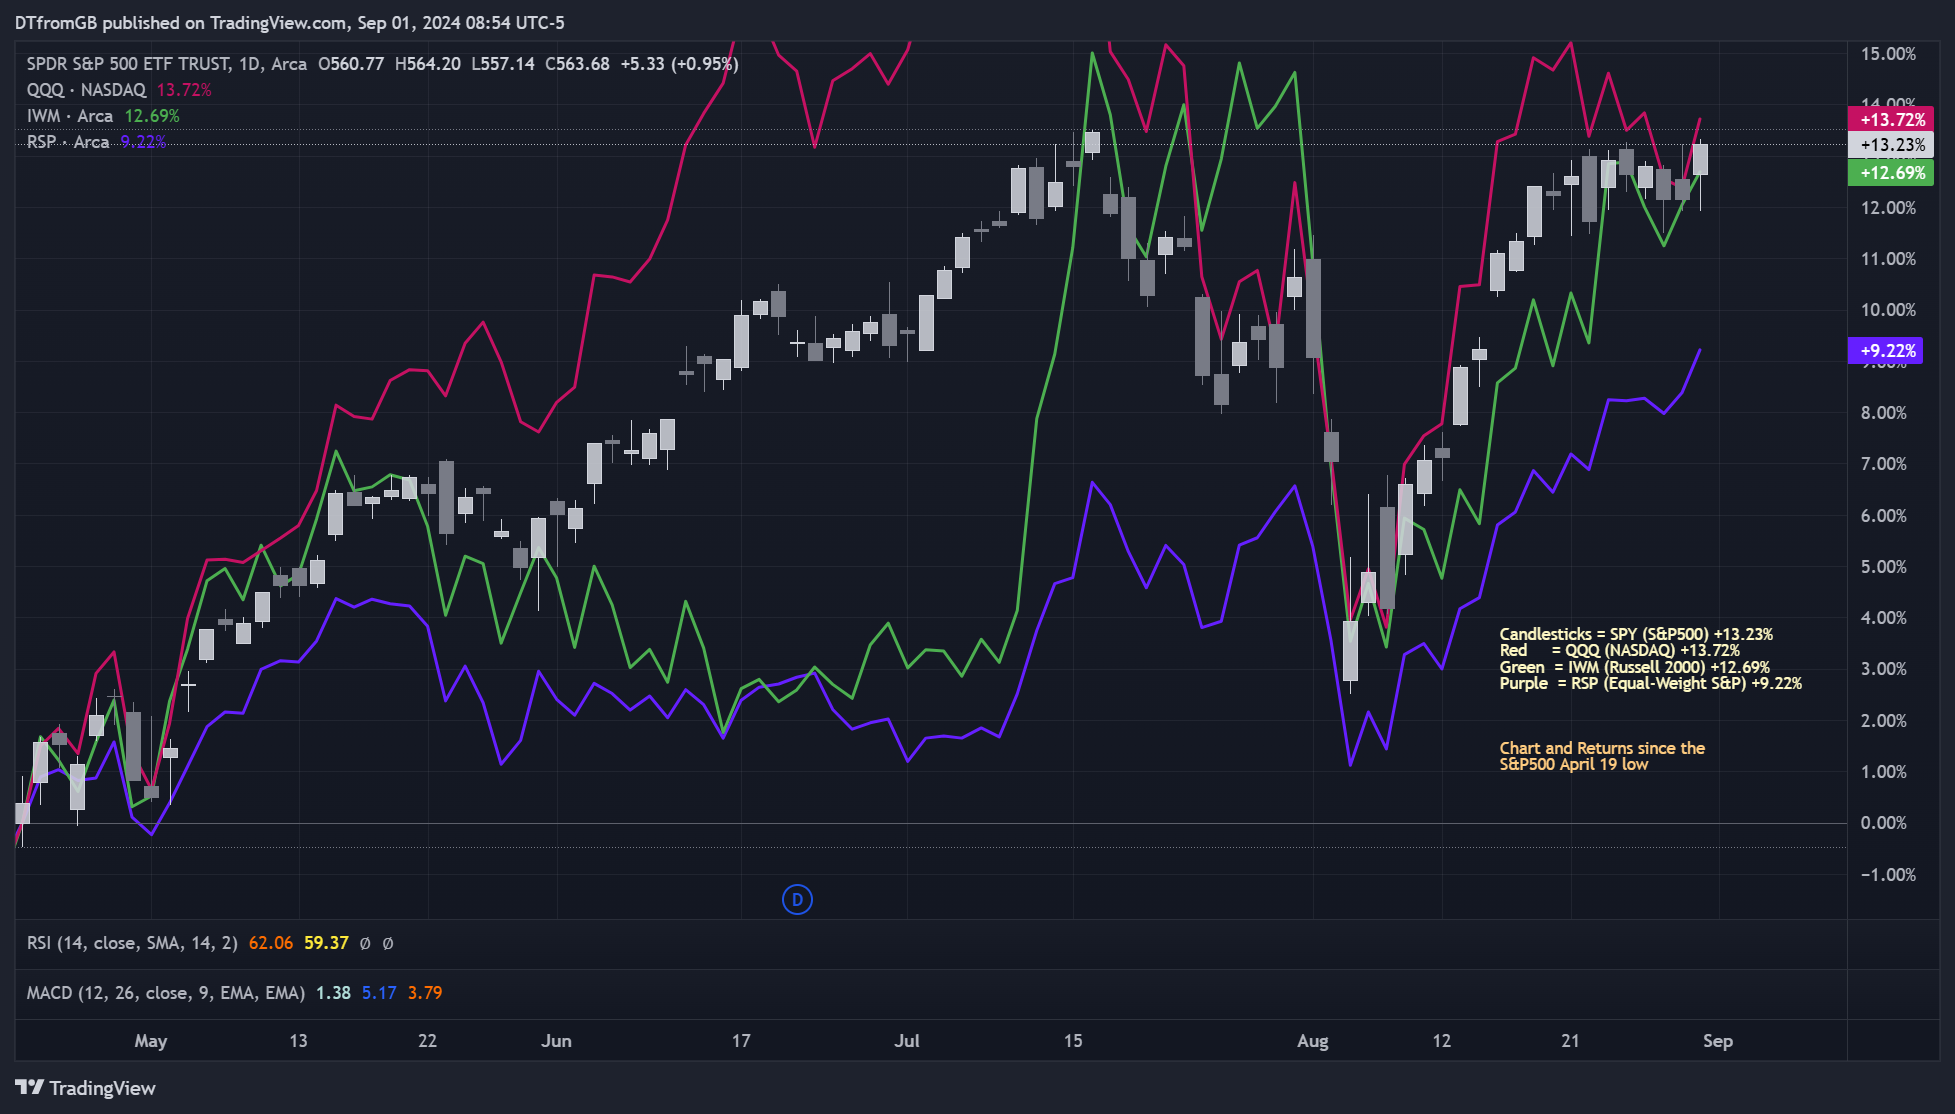
Below is a chart comparing the SPY (S&P500 Index in the white candles) with the QQQs (NASDAQ in red), IWM (Russell 2000 in green), and RSP (equal-weighted in purple) since the market lows in mid-April. SPY, QQQ, and IWM all have similar returns around 13% with the RSP up only 9.2%. However, RSP is the only one that has made new highs by the end of the month where the others have fallen short.
Clean Energy Portfolio Performance
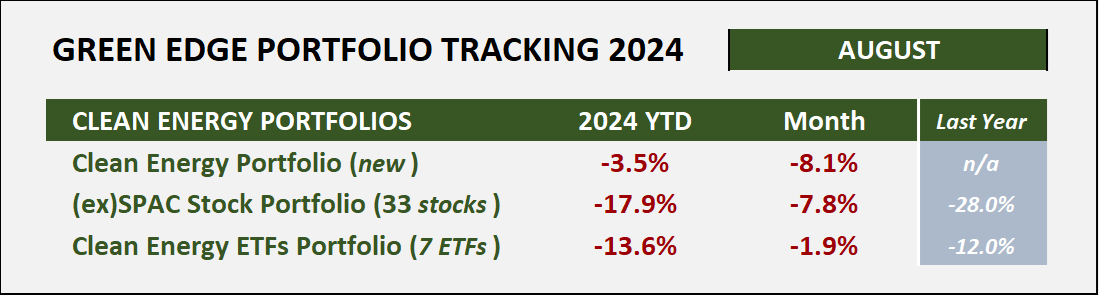
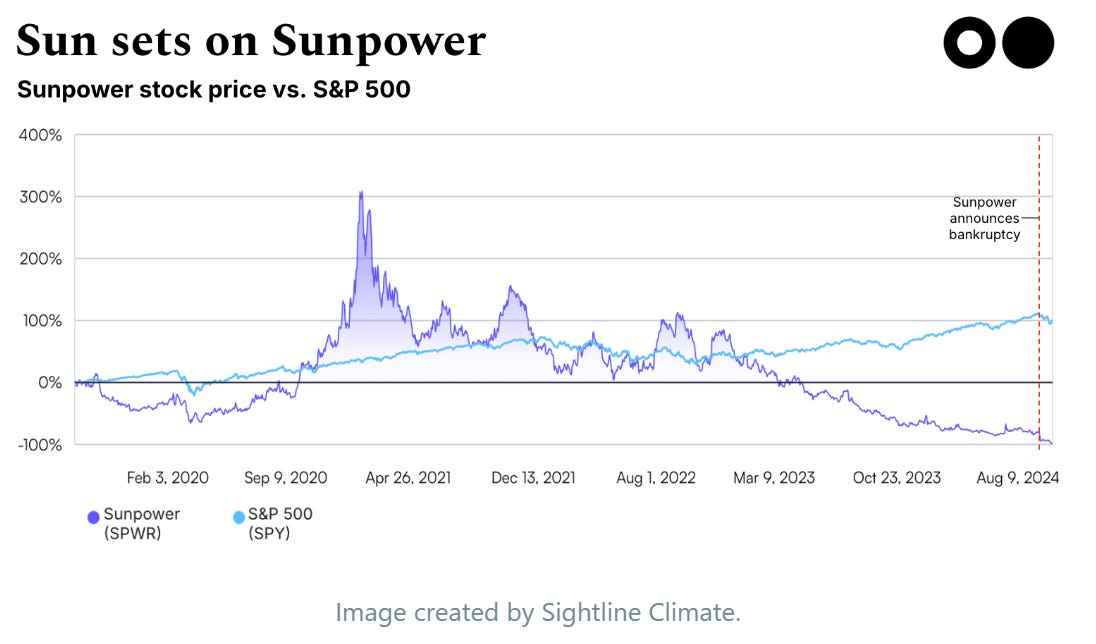
Clean energy stocks performed poorly in August with the basket of ETFs down almost -2% and the riskier ex-SPACs down nearly -8%. Residential solar heavyweight Sunpower announced it was filing for bankruptcy in August.
Let’s visit what happened to SunPower. Founded in 1985, SunPower switched to focus on rooftop solar in 2020 — capitalizing on low interest rates and high incentives for residential solar installations. The company’s share price soared to an over $9 billion market cap in January 2021. However, it faced headwinds in 2022:
Rising interest rates rain on the parade. When the Fed raised interest rates, the solar industry, which often leverages debt to pay upfront for pricey solar projects, faced higher borrowing costs.
Policy changes strike the sector. California Public Utilities Commission slashed its Net Energy Metering (NEM) incentives, which paid homeowners for feeding their excess solar energy back to the grid. The new rate cut payments by 75% which led to a significant decrease in residential solar installations across CA.
SunPower faced not only these macro-level challenges, but also had to wrestle with a departure of its CEO, a subpoena from the U.S. Securities and Exchange Commission about its accounting practices, and a debt default in December 2023.
Amid the broader stock market downturn in early August, SunPower's shares withered away, closing out August at $0.06 per share.
There have been other solar company bankruptcies as well, but some companies are successfully recalibrating their business models to compete. Sunrun, for example, has reportedly already hired from SunPower, and its shares jumped 11% by last Wednesday.
Looking forward, solar capacity remains at an all-time high. According to the IEA solar PV alone accounted for three-quarters of renewable capacity additions globally. The demand is there, even if the supply and incentives are unevenly distributed.
Renewable energy companies, who are highly sensitive to regulatory and macroeconomic shifts, are anxiously awaiting the Fed’s decision to cut interest rates for the remainder of the year. This could significantly impact project finance investment in solar and other infrastructure.
Batteries are gaining in popularity as there have been major technological advancements in batteries — duration has gone up; prices have gone down — have already begun to transform renewables markets and policies. While California cut NEM incentives, it added new solar-and-battery system incentives (as have some other states).
Talking about batteries, one bright spot has been EOS Energy (EOSE). EOSE traded as low as $0.61/share on May 8, 2024, and has rallied to a 2024 high of $2.81 on August 29th, up +360%. We have discussed EOS here before as it has met several critical milestones in building out its first production line for long-term duration batteries. The new energy demand from Artificial Intelligence data centers is pushing utilities to look at all options. Long-duration batteries would be a great solution, if it can get online soon.
In our Green Edge groups, the Lead by Example portfolio continues to push performance over the S&P index — by +0.5% in August and +1.5% YTD.
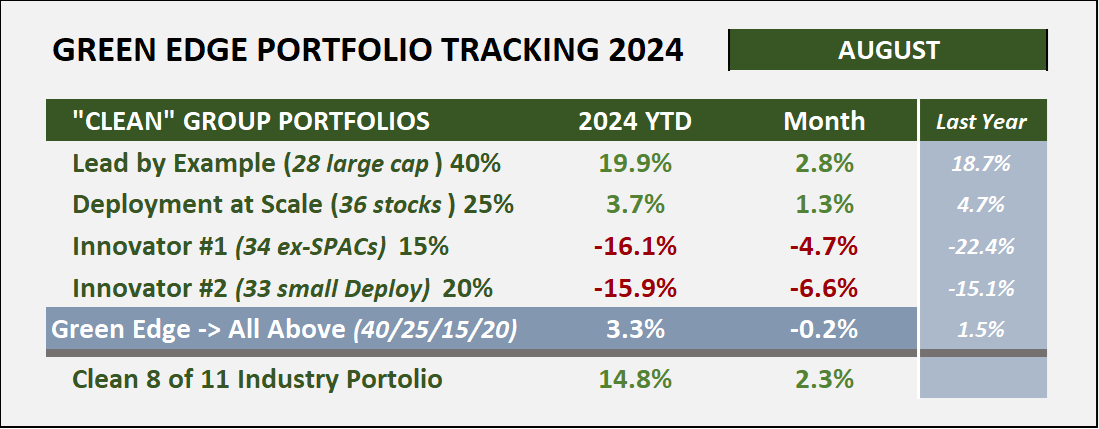
The Innovators groups are in the same boat as the rest of the clean energy sector. The 8 of 11 industry portfolio matched the S&P this month, but trails YTD.
Cryptocurrency Portfolio
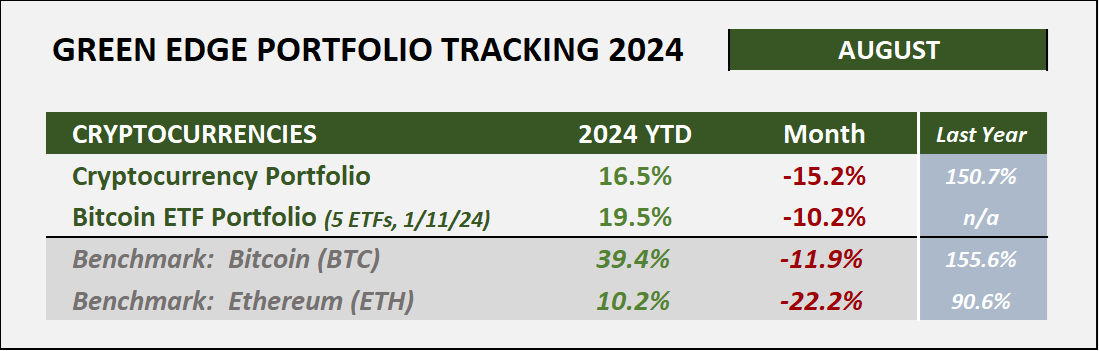
For the first time this year, the cryptocurrency portfolio of 10 tokens trails the S&P500 YTD, +16.5% versus +18.4%. However, Bitcoin remains the strongest up +39% YTD, although it retracted -11.9% in August.
Why is the Bitcoin ETF portfolio only down -10.2% as compared to Bitcoin’s -11.9%? Shouldn’t that be the same? The difference is that the ETFs only trade when the stock market is open → M-F during market hours whereas Bitcoin trades 24/7, 7 days per week. Therefore, the “month” doesn’t start and end at exactly the same time (or sometimes same day, accounting for weekends).
Hope that you all had a great Summer and are looking forward to a fabulous Fall.
Efficiently Yours,
D.T.