

Positive Momentum into the End of Year
Positive Momentum into the End of Year
Green Edge Portfolio Performance for November (#37)

The highest daily S&P 500 (SPX ticker) close of the year was hit on July 31st at 4,592. On Friday, December 1st, SPX closed at 4,594. The performance in November (and first day in December) erased the whole three-month correction of -8.6% between August and October. Can we continue the momentum into the end of the year, delivering on the annual Santa Claus rally?
There are a couple of indicators we can look at to determine whether the price is at an excessive level. The two indicators we will explore are the Fear/Greed Index and the Relative Strength Index (RSI). When evaluating the index level, the further the index has moved to very low or very high, the market has usually gone too far in one direction - Up or Down.
Fear & Greed Index. If over 75, the market is considered in Extreme Greed and could signal price has gone too high. If under 25, we are in Extreme Fear and likely have sold off too far. This is a contrarian point of view.
Relative Strength Index. RSI measures the speed and magnitude of a security's recent price changes to evaluate overvalued or undervalued conditions in the price of that security. An asset is usually considered overbought when the RSI is above 70 and oversold when it is below 30.
In late July when SPX hit 4,592, the Fear & Greed Index was at 83, or into the Extreme Greed category. At the end of November, the index reads 66, or just the regular old Greed level. To compare the readings on the RSI on the weekly chart for SPX, July index was at 72 versus end of November at 62.
Using these two indicators, it shows that the SPX is not as overbought as it was at this same price level in July. We may have more room to maneuver higher over the next month or two. All-time highs? Only time will tell.
Let’s look at last month’s performance.
Portfolio Performance Table & Discussion

November gave us a rebound that eliminated the three down months of August through October with the S&P500 gaining +8.9% and the NASDAQ up +10.7%. The small cap Russell 2000 delivered results right in the middle of those indexes at +9.2%.
The Clean Energy ETF portfolio delivered results on par with the S&P moving up +9.0%. However, note that the Innovator #1 which is made up of 43 clean energy de-SPACed companies, trailed significantly gaining only 1.5%. And the only negative reading for the month was in my Top Picks SPAC portfolio, which can hardly be called “Top Picks” any longer, down over -55% YTD and -1.2% in November.
S&P 500 Index Analysis
The S&P500 Index has moved up five weeks in a row as of the week of November 27th. The “five-weeks-in-a-row-Up” has happened twice earlier in 2023. Let’s see if we can get an indication of what happens next based on previous results. (note: previous results do not guarantee future performance) :-)

The first time SPX rallied up five weeks in a row was during the weeks of 3/13 to 4/10 (1st yellow arrow), the index moved up +6.9%, then had four weeks of consolidation with a total loss of -1.2% (yellow circle).
The second time, in weeks 5/15 to 6/12 (2nd yellow arrow), the S&P gained +7.2%, but then lost -1.5% in week six (second yellow circle). However, it came back to rally up another 5.4% in the following month to the highest level in 2023 hitting 4,606.
Currently, in weeks 10/30 to 11/27 (red oval), the SPX is up +11.6%.

This time the index has made its highest weekly close since 12/27/21. There is strong momentum building into the final month of the year and everyone is cheering for the Santa Claus rally to carry us to new all-time highs. But, as in the last two times shown above, we are due for a rest or pullback.
SPX hit 4,637 in March of 2022, the first bullish retracement of that bearish year. It would make sense for the market to test that level and then pullback or consolidate. With the current momentum, the rest could be short, the pullback could be shallow, and the momentum could take the market to test the all-time high at 4,817 by the end of the year. The highest daily close is 4,794.
Anything can happen in the market, including black swan events, so making predictions is a tough business. However, I have published a Predictions edition each year, putting it all on the line. Therefore, let’s get a little practice in and predict where the SPX price goes in the near future.
Low for December of 2023: 4,550. End of Year close forecast: 4,790. And hit 5,000 in Q1-2024.

Clean Energy Comments
Clean energy stocks have been under pressure all year and have underperformed the market indexes (see the graph in the last edition). As interest rate increases by the Fed stop and rates begin to decline, these companies’ stocks will get some love. However, for many of the very small cap companies, much of the damage has been done. Hence, the companies that emerged via SPACs are so beaten down and the balance sheets so troubling, that they continue to not get any attention while they try to figure out how to finance their future growth prospects.
Proterra PTRA, an electric bus maker and one of my early favorites, went into bankruptcy a few months ago. It has broken out the business into separate units that will be acquired by Volvo and Phoenix Motors for a couple hundred million dollars. However, not sure any of that makes it to the stockholders as it is now trading at <$0.03/share. But I was very happy to hear that the products can live on and make an impact in the industry.
Li-Cycle LICY, a recycler of batteries, announced in late October that it is pausing construction work on its Rochester Hub project. The company said construction is pending until a comprehensive review of the go-forward strategy for the project is completed. The DOA Loan Office had provided Li-Cycle with $375 million loan commitment through the Advanced Technology Vehicles Manufacturing program for this project. Stock trades at $0.79 per share and had been valued at over $5 per share this summer.
As I mentioned last month, the 2024 portfolio will open up to additional clean energy companies and not be limited to the ones that came public through the SPAC vehicle.
Cryptocurrency Performance
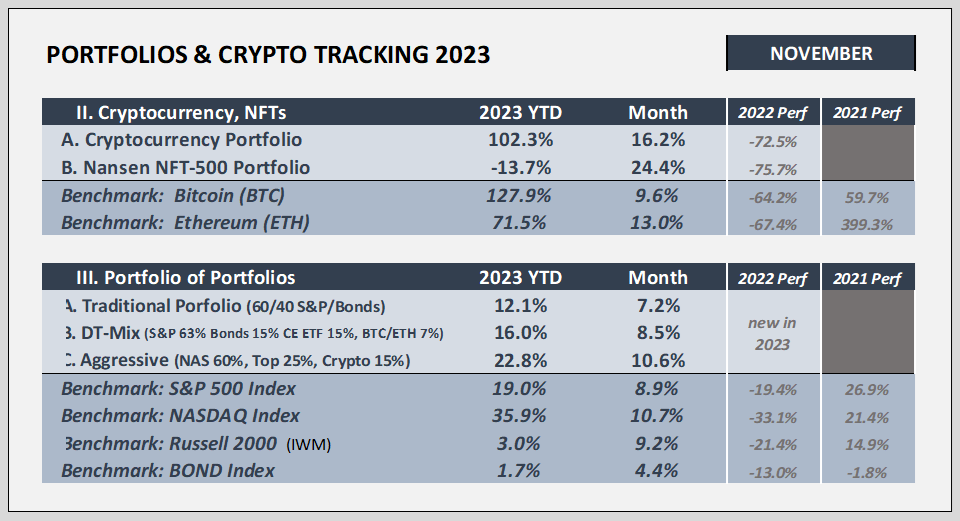
The cryptocurrency portfolio has officially doubled YTD, up +102.3% for the year and +16.2% last month. Bitcoin has led the way moving up +127.9% YTD and +9.6% in November. As we speak (December 4th), Bitcoin has just crossed over $40,000 and made its way to nearly $42,000.
“Bitcoin dominance” can be an interesting indicator as it refers to the percentage of the whole cryptocurrency market that is made up by the value of Bitcoin’s market share. The percentage has moved from 42% at the beginning of the year to 54% today (more than half of crypto’s market cap is in BTC). An increase in this percentage means that Bitcoin price has been much stronger than the rest of the crypto market 2023 YTD.
Using technical analysis, a target in the range of 56-57% would make a lot of sense (a 50% retracement from the highs in 2021 to the lows in 2022). During crypto bull markets, usually at some point Bitcoin takes a rest or consolidates and the alt coins take the baton and surge ahead. Again, with the predictions, but it feels like Bitcoin’s bullish run plateaus somewhere between $42k and $48k, then corrects while the alt coins play a catch up. This is powerful because alt coins can run 2-3x or more within a month or two during these times.
But be careful as I don’t really have a lot of confidence in the long-term prospects of many of the alt coins. One way to look at it could be using profits from alt coins to add more long-term Bitcoin into your portfolio. I have recommended in the past to keep cryptocurrency at 1% to 10% of your portfolio as an alternative asset class.
Efficiently Yours,
D.T.